min read
October 13, 2026
Data Bites: Office Pantry Spend Per Employee by Industry in 2026
See how much seven industries spend on their office pantries per employee, per day, and what's driving the differences.


Pantry budgets are often measured by how much a company spends. But that number says little about the experience employees actually receive. Cost per person per day puts that investment into perspective, giving workplace leaders a clearer way to evaluate their program, compare against industry peers, and determine whether their budget is keeping pace.
Using data from Crafty's Pantry Intelligence Index, we analyzed per-employee pantry spend across seven industries during the first half of 2026.
The findings point to a bigger conversation about the role of workplace food. As industries compete for talent, navigate changing work patterns, and rethink how they invest in their people, pantry spending reflects the demands being placed on their workforce. Understanding those differences helps workplace leaders make more informed decisions about where to invest and why.
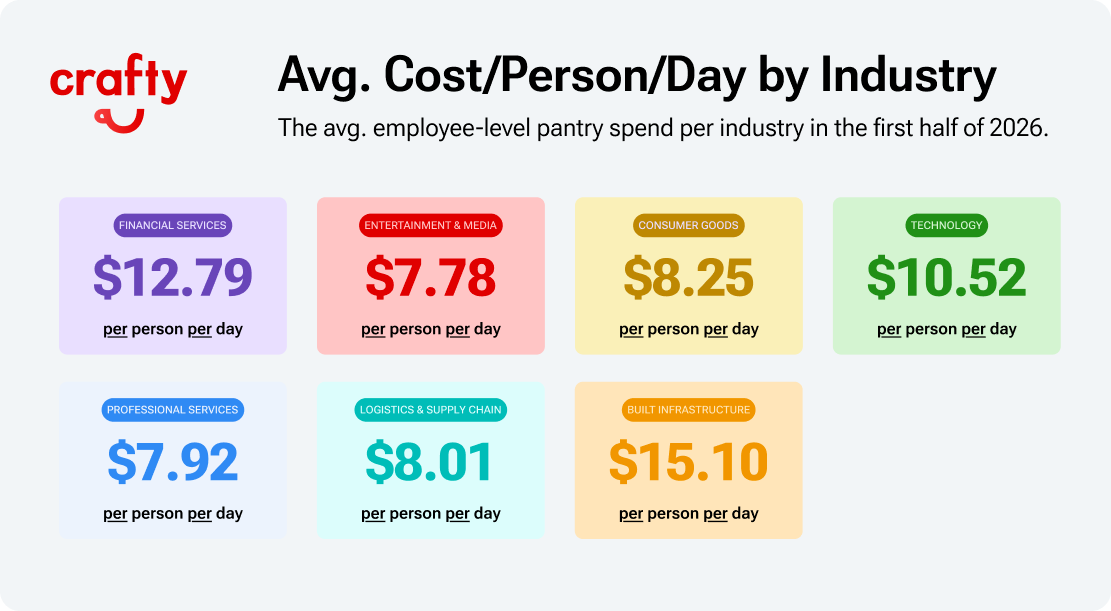
Average Office Pantry Spend Per Employee by Industry
Across Crafty's network, the average office invested $10.85 per employee per day in its pantry program during the first half of 2026. That investment varies significantly by industry, reflecting different expectations for the workplace and the people who power it.
Here's how seven industries compare:
- Built Infrastructure: $15.10 per person per day
- Financial Services: $12.79 per person per day
- Technology: $10.52 per person per day
- Consumer Goods: $8.25 per person per day
- Logistics & Supply Chain: $8.01 per person per day
- Professional Services: $7.92 per person per day
- Entertainment & Media: $7.78 per person per day
For workplace leaders, these differences matter. Companies are competing for talent within their industries, where employees have similar expectations and employers face similar workforce pressures. Understanding what your peers invest gives you a stronger foundation for evaluating your own budget and making the case for what your people need.
What Each Industry’s Pantry Budget Buys
The amount companies spend per employee directly influences the scale, variety, quality, and experience they can offer in their pantry. At Crafty, we use cost per employee tiers to help workplace leaders understand what different budget levels can support.
Higher per-person budgets give companies more flexibility to offer a wider selection of products across categories, brands, and flavors, creating an experience that caters to more employee preferences.
- Premium ($10+ per person per day): Built Infrastructure, Financial Services, and Technology fall into this tier, supporting an extensive assortment across snack and beverage categories, with more brands, flavors, premium products, and options for different dietary preferences.
- Elevated ($7.50–10 per person per day): Consumer Goods, Logistics & Supply Chain, Professional Services, and Entertainment & Media fall into this tier, supporting a well-rounded assortment of everyday favorites, healthy snacks, and fresh options, with a more curated selection of brands and flavors.
These differences translate into the everyday experience each employee receives. Understanding what each budget level supports helps workplace leaders evaluate whether their investment matches the experience they want to deliver.
What's Driving Pantry Spend in Each Industry?
Every industry faces different workforce demands, talent pressures, and business priorities. Those differences influence how companies invest in their people and what employees need from their workplace experience.
Here's how broader industry trends connect to the consumption patterns we're seeing across Crafty pantries:
- Built Infrastructure: As AI and sustainability reshape the industry, companies need to support a workforce moving between offices, job sites, and field operations. With hydration critical to preventing heat-related illness, pantry investment prioritizes water, coffee, and portable, high-protein snacks that keep employees fueled throughout physically demanding workdays.
- Financial Services: Financial firms are increasingly competing for talent, particularly as AI transforms the industry. Long hours and high-pressure work environments create demand for convenient, functional foods and beverages that support sustained energy and focus.
- Technology: AI is transforming work, shifting responsibilities and creating new demands for collaboration and human judgment. Tech pantries balance wellness-forward products with familiar favorites, creating opportunities for employees to recharge and connect throughout increasingly digital workdays.
- Consumer Goods: Changing consumer expectations and AI-driven innovation are putting pressure on companies to move faster, while talent retention remains a challenge. Pantry consumption favors coffee, Greek yogurt, and fresh foods that fuel busy teams and create a consistent workplace experience.
- Logistics & Supply Chain: Physically demanding roles, changing schedules, and constant movement make convenient nutrition a priority. Hydration is especially important for active workers, while coffee and portable, protein-rich snacks like yogurt, nuts, and jerky provide accessible options throughout the shift.
- Professional Services: As AI takes on more analytical tasks, human judgment, client relationships, and sustained focus become increasingly valuable. Research connects hydration with cognitive performance and mood, reinforcing the role of water alongside fruit, fiber-rich foods, and protein-forward snacks in supporting demanding workdays.
- Entertainment & Media: Production schedules, tight deadlines, and irregular hours put significant pressure on employees. Research found that nearly one in five film and TV workers reported working 50 or more hours per week. Pantry consumption leans toward protein-forward snacks for convenient fuel, with smaller sweet treats offering moments of enjoyment during production sprints.
3 Workplace Trends Shaping Pantry Investment in 2026
Pantry investment doesn't happen in a vacuum. The same pressures reshaping how companies operate are influencing how they invest in their people. From the race for specialized talent to rising food costs, workplace leaders are balancing the need to deliver a competitive employee experience with the realities of their budgets.
Three trends help explain where those priorities are shifting:
- Competition for Specialized Talent: AI is changing who companies need to hire. At major global banks, AI headcount grew five times faster than overall hiring. As financial firms compete with technology companies for the same engineers and data scientists, workplace perks become another way to differentiate the employee experience and retain hard-to-replace talent.
- Greater Emphasis on the Employee Experience: In a 2026 survey, 73% of employees said benefits matter as much as or more than salary. For companies bringing employees into the office, the pantry is a tangible, daily investment in their people. The quality, variety, and availability of food help shape the experience employees associate with coming to work.
- Rising Food Costs: Food prices rose 3% year over year as of June 2026, putting more pressure on employees' wallets. A well-stocked pantry can offset $10-20 in daily personal spending on snacks, coffee, and beverages. For employees, that means real financial relief. For employers, it's an opportunity to make their investment go further by delivering value employees feel every day.
How to Compare Your Pantry Spend to Your Industry Benchmark
Your pantry budget should reflect the employees you're trying to attract, support, and retain. Knowing what companies in your industry invest gives you a stronger foundation to advocate for the resources you need to compete.
The key is putting that number into context. Our guide on how to benchmark your office pantry walks through how to compare your investment against peers, evaluate employee needs, and build a business case leadership can act on.
Here's how to frame the conversation based on where you stand:
- Above the Benchmark: Your higher investment may be a competitive advantage. Use consumption and employee feedback to show what employees value, justify the premium, and protect the experience that sets you apart.
- At the Benchmark: You're keeping pace with industry peers. Identify where your program delivers value and where additional investment could help you stand out in the competition for talent.
- Below the Benchmark: Lower spend may reflect efficiency or an experience that falls short of employee expectations. Use stockouts, product requests, and satisfaction data to demonstrate what's missing and make the case for closing the gap within your office pantry budget.
The strongest budget conversations connect investment to outcomes. Use your industry benchmark to establish what competitors are spending, your pantry data to show what employees need, and both to justify where to maintain, reallocate, or increase your budget.
Investing With Intention
Every industry asks something different of its people, and workplace investment should reflect those demands. The strongest pantry programs are built around how employees work, what they need to perform, and the experience companies want to deliver.
Industry benchmarks give workplace leaders the context to make those decisions with confidence. They help you understand what it takes to compete, where your investment stands, and how to make the case for the resources your people need.
Explore Crafty's Pantry Intelligence Index to compare your office pantry spend against your industry, market, and company type.
Related Resource

Blog
Best Organic Office Snacks: What to Stock and How to Read the Labels
October 13, 2026
Blog
Data Bites: Office Pantry Spend Per Employee by Industry in 2026
October 13, 2026

Blog
Inside Office Digest: How Crafty Measures Office Pantry Program Performance
October 12, 2026
Blog
Equipment Guide: Cold Water Machines for the Office
October 8, 2026

Blog
How to Reduce Office Pantry Costs with 7 Optimization Tips
October 8, 2026
Blog
November Holidays for Work: Snack Celebrations for Your Breakroom
October 8, 2026

Blog
How to Benchmark Your Office Pantry and Make the Case for What You Need
October 7, 2026
Blog
Fueling the Season: Inside a Pro Sports Organization's Workplace Food Program
October 7, 2026
Blog
How Much Does an Office Pantry Cost per Employee: 3 Tiers for 2027
October 7, 2026
Blog
How to Calculate Your 2027 Office Snack Budget
October 7, 2026