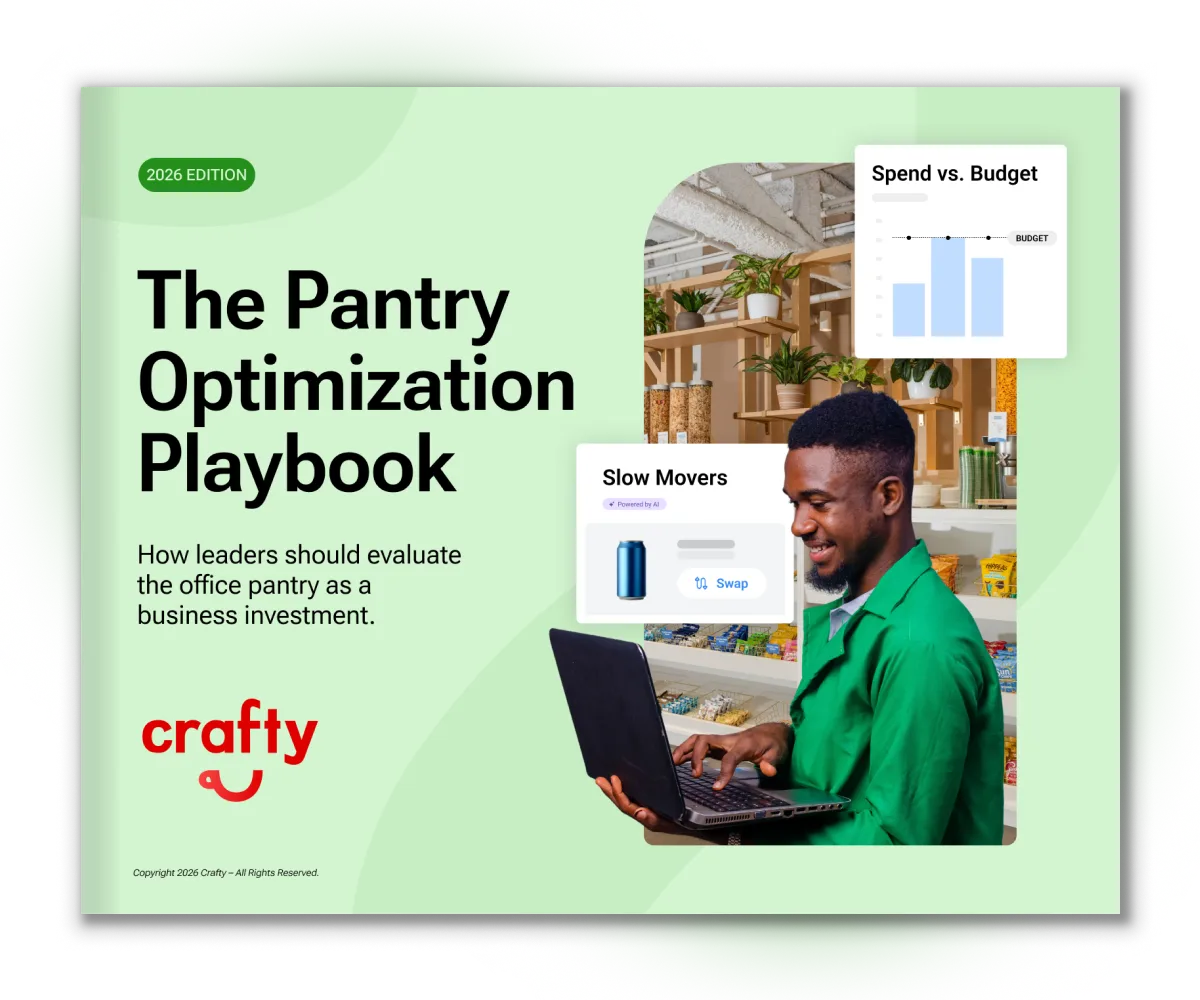
INTERACTIVE PANTRY TOOL
Crafty’s Pantry Intelligence Index
The first and only pantry benchmark tool powered by real workplace data.
For most workplaces, pantry decisions are still driven by guesswork: ordering based on habit, reacting to employee requests, and hoping they're making the right investments without the data to know. Crafty is changing that. Through the Crafty Platform, workplace teams already have quantitative data on what employees do and qualitative data on what they want. Now, we're adding the third layer: market intelligence built from real spend, inventory, and product data from Crafty-powered pantries.
Benchmark your pantry against your peers and filter by industry, company type, and city to see exactly how you stack up.
THE PAYOFF
Turn intelligence into your competitive edge.
Context
Understand where your workplace stands against peers, talent competitors, and the market.
Strategy
Turn market intelligence into action by identifying opportunities to refine your assortment, anticipate trends, and make more informed investment decisions.
Confidence
Validate your strategy with objective data, build stronger business cases, and confidently defend workplace investments to leadership.

See How Your Pantry Program Compares
The next generation of pantry programs will be defined by precision, informed by data, and strengthened through continuous optimization.
Q2 revealed a clear shift in how organizations are managing workplace pantry programs. As AI raises expectations for productivity and intensifies competition for specialized talent, workplace leaders are under pressure to deliver programs that perform. At the same time, employees are gravitating toward healthier, more functional choices, fueling demand for protein-rich snacks, fresh produce, hydration, and functional beverages. In an environment defined by tighter budgets and higher expectations, data is becoming the key to making smarter decisions for continuous optimization.
Explore Crafty’s Pantry Intelligence Index
Built from real data across hundreds of US workplaces, these benchmarks represent companies with 50 to 10,000+ employees. Use them as a point of reference, as factors such as company size, attendance patterns, industry, and culture can impact pantry data. We're continually expanding our dataset and adding new ways to compare.
Built from the only dataset in workplace pantry.

300k+
Employees supported

750+
Office locations

45+
Cities served
Get more Crafty insights.

Blog
Best California Snack and Coffee Brands to Stock in Your Office Pantry
September 10, 2026
Blog
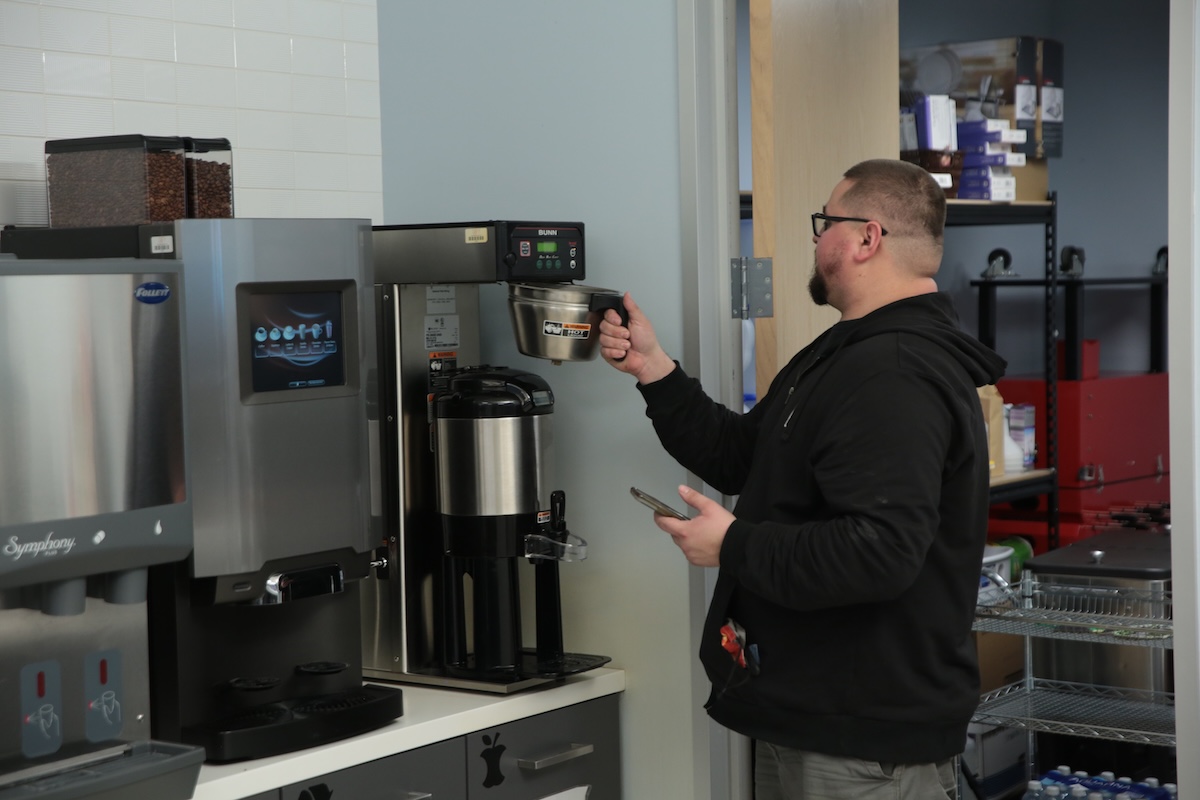
Office Equipment Guide: Drip Coffee Machines for the Office
September 10, 2026

Blog
Celebrate Halloween at Work: Breakroom Snacks, Activities, Decor, & More
September 9, 2026
Blog
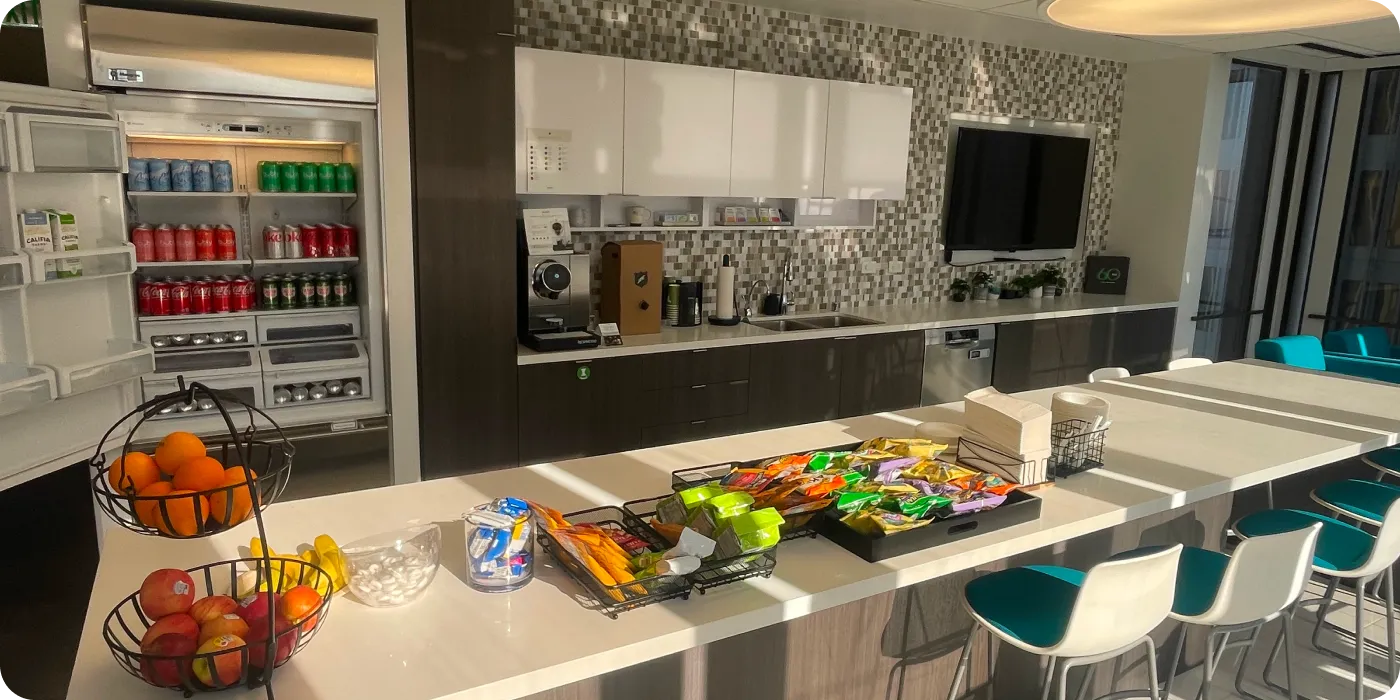
October Holidays for Work: Breakroom Snack Celebrations
September 9, 2026

Blog
Best Chicago Snack and Coffee Brands to Stock in Your Office Pantry
September 2, 2026

Blog
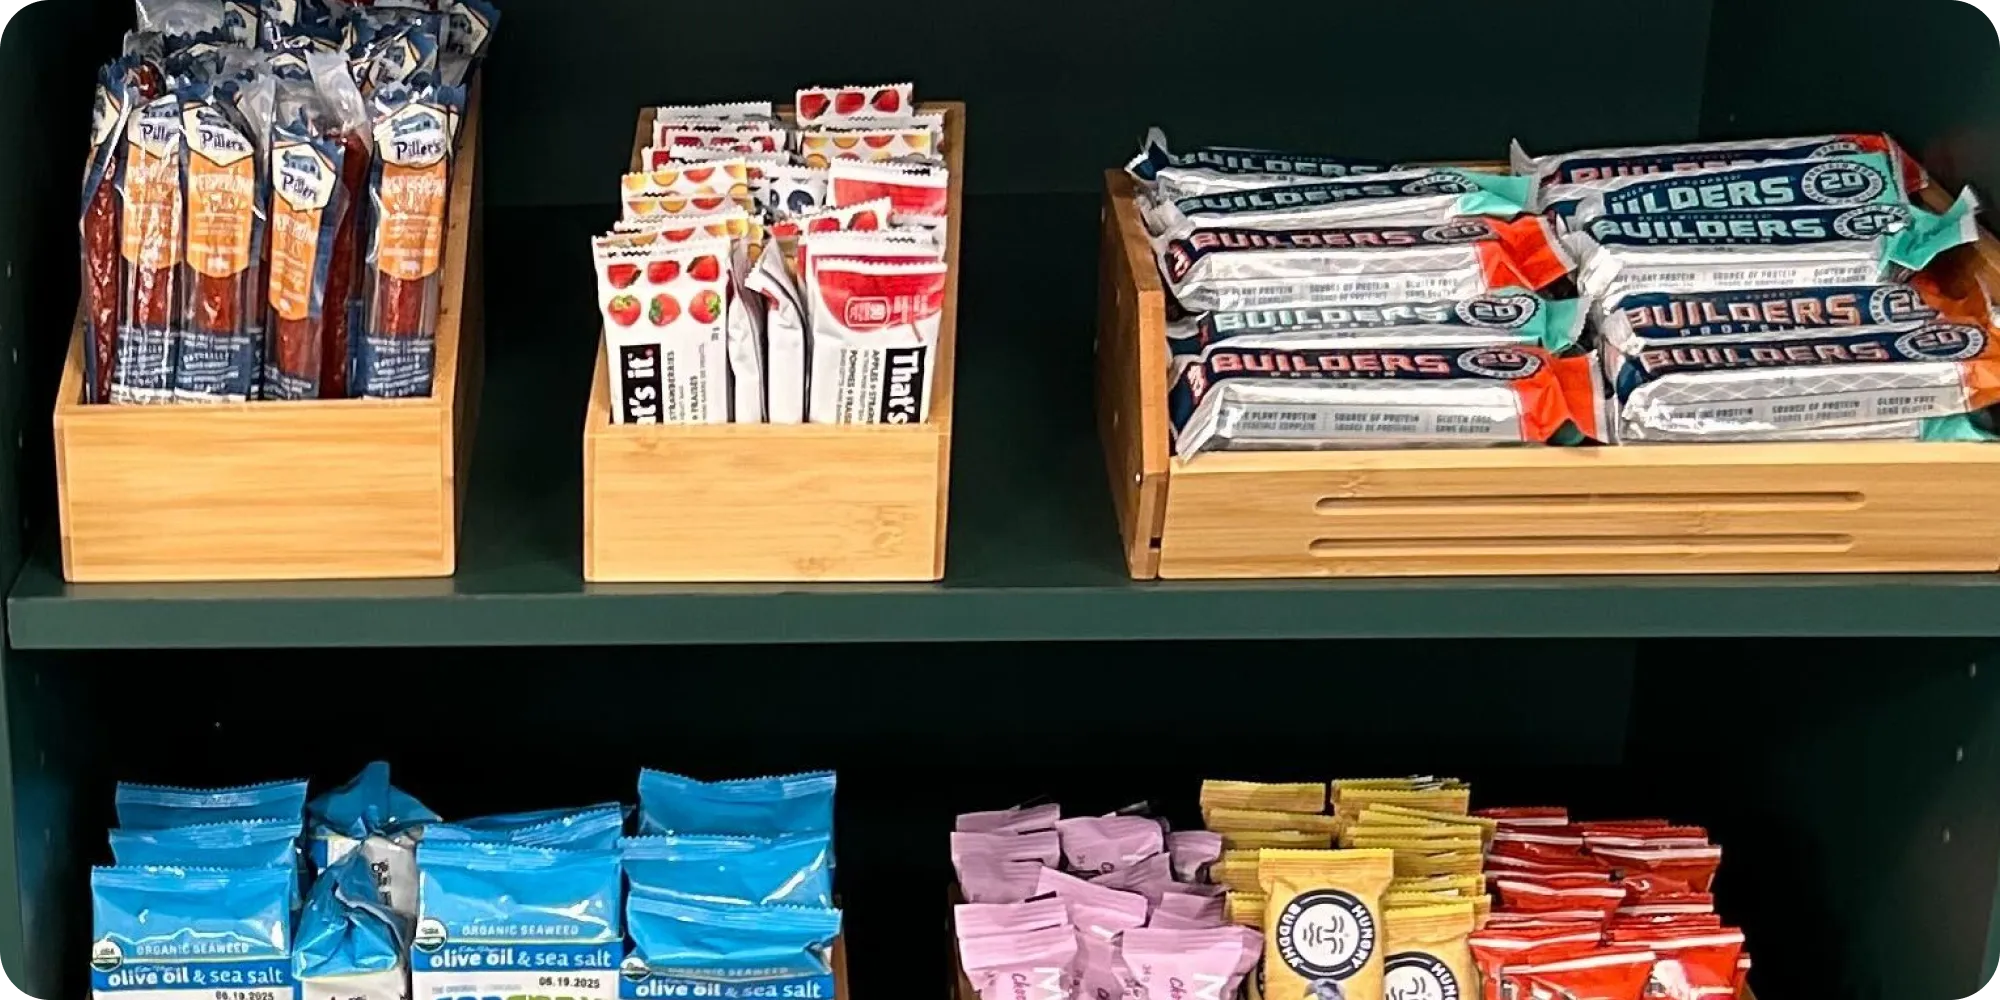
Office Snack Scoop Episode 1 Takeaways: Fiber, Flavormaxxing, and the Beverage Boom
September 1, 2026

Blog
Hispanic Heritage Month at Work: Office Snack Ideas & LatinX-Owned Brands to Try
September 1, 2026

Blog
Fall Office Breakroom Ideas: Trends, Flavors, and Easy Swaps
August 26, 2026

News
Crafty Unveils 2026 Summer Platform Release to Give Workplace Teams More Context, Control, and Convenience
August 21, 2026
Get the Definitive Guide to a Pantry That Performs
12 actionable strategies to drive performance
Technology recommendations to execute without complexity
KPIs to measure impact and prove program value to leadership