min read
October 26, 2026
Q3 2026 Office Pantry Benchmarks
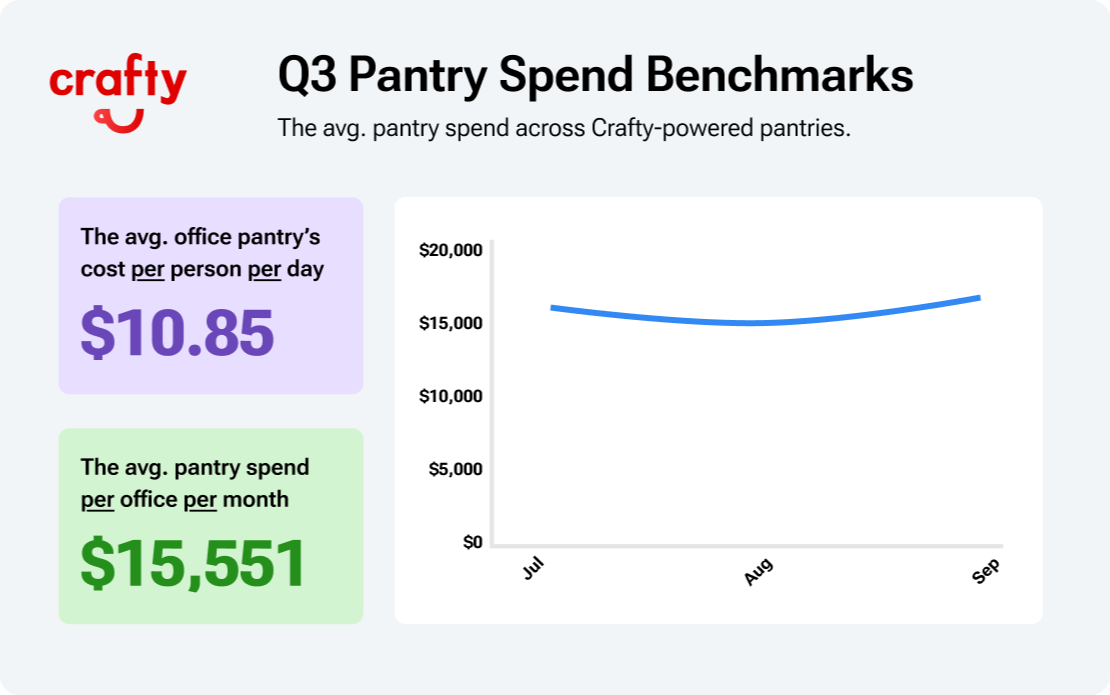
Office pantry spend averaged $15,551 a month and $10.85 per person per day in Q3 2026. See the benchmarks by city, industry, and best-selling product.

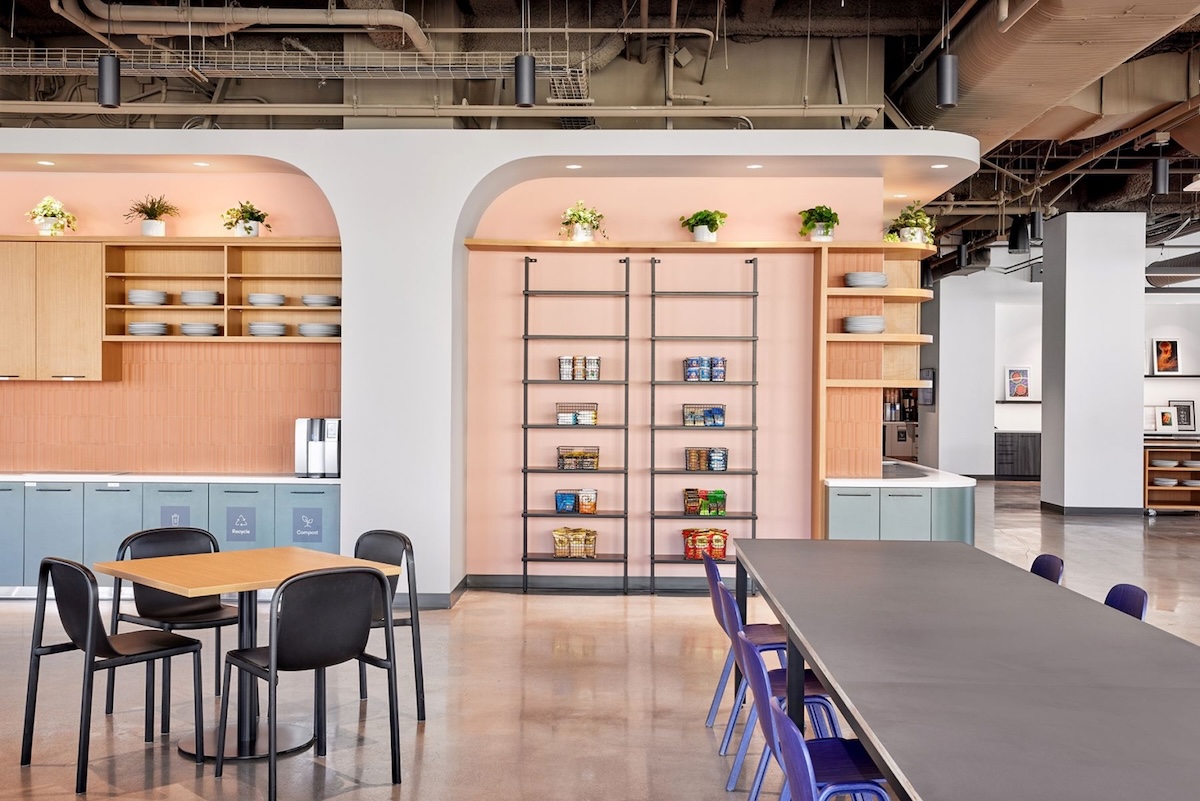
September brought employees back to the office in numbers we haven't seen in years. After a quieter summer, office visits reached their highest September level since 2019.
But getting people back is only part of the equation. AI is reshaping the talent companies need, competition for specialized skills is intensifying, and employee engagement remains a challenge. In fact, 59% of HR leaders struggle to attract talent with critical digital skills. As a result, workplace teams are being asked to deliver experiences that help attract, retain, and engage employees while facing greater scrutiny over how every dollar is spent.
That puts a higher premium on data. Workplace leaders need to understand how their investments compare to the competition, what they're delivering to employees, and where there's room to improve. For pantry programs, that means looking beyond total spend to understand how much is being invested in each employee's daily experience.
That's why this quarter's benchmarks introduce a new headline metric: cost per person per day. Paired with monthly spend, it reveals which industries and cities are investing the most in each employee's daily experience.
Powered by the Crafty Pantry Intelligence Index, this analysis explores what we're seeing across Crafty-powered pantries in Q3 2026, how investment varies by industry and market, and what the numbers mean for your own pantry program.
Methodology Behind Crafty's Q3 Pantry Benchmarks
This analysis draws on 750+ Crafty-powered pantries across our US and Canadian markets from July through September 2026. Spend figures, including average monthly spend and cost per person per day, reflect the collective average across our network, with all dollar figures reported in USD. Top subcategories and best-selling products are ranked by units delivered across that same network.
Q3 2026 Office Pantry Benchmarks at a Glance
Q3 was the strongest quarter of 2026 so far. The average office spent $15,551 per month, up 1.5% from Q2 and above the year-to-date average of $15,308.
That breaks the usual summer pattern. In past years, vacations and flexible schedules leveled pantry spend through July and August. This year, offices stayed busy. July office visits climbed above June, making it one of the busiest in-office months since 2020. More employers also added in-office requirements heading into fall, with companies like Fidelity and TikTok moving to full-time office schedules in September. When more people show up, pantry spend follows.
More employees are returning to the office, but showing up comes at a cost. The average employee now spends $55 a day working in person, which makes workplace food programs a core part of the employee experience.
Cost per person per day measures the average pantry investment per employee for each day the office is open. In Q3, it held steady at $10.85 even as attendance climbed, a sign that employers scaled their programs to keep pace with more people in the office.
Q3 Office Pantry Spend Across the US & Canada
- Average monthly pantry spend per office: $15,551
- Average cost per person per day: $10.85
Key Q3 Office Pantry Insights
- Q3 finished stronger than it started: Q2 peaked in April and drifted lower through June. Q3 did the opposite. With the Fourth of July falling on a Saturday, employees didn’t need to take as many days off around the holiday, and July office visits climbed above June. Spend dipped in August as late-summer travel thinned out offices, then September climbed to nearly match March, the high point of the year. That gives 2026 two clear peaks, spring and fall, and carries momentum into Q4.
- Employers protected the employee experience: As office attendance climbed, pantry investment kept pace. Cost per person per day held at $10.85, in line with the year-to-date average of $10.89. With 25% of employees citing pantries and kitchenettes as important workplace amenities, maintaining that investment helps protect the everyday experience that attracts and retains talent.
- Beverages caught up to snacks: Beverage spending climbed in Q3, accounting for 34% of pantry spend and essentially tying with Snacks & Pantry at 34.1%. Summer heat drove demand, but the trend goes beyond warmer weather. Beverages are increasingly replacing traditional snacks, with 68% of consumers saying they sometimes reach for a drink instead of food, up seven percentage points since 2021. We're seeing that shift in office pantries, too, with LaCroix, C2O coconut water, and CELSIUS among Crafty's top sellers.
Pantry investment looks different in every market. Local hiring, industry mix, and office attendance all shape how employers spend, and Q3 showed just how far those differences can stretch from city to city.
Office Pantry Spend by City
The cities leading pantry spend in Q3 reveal where employers are putting their dollars, and how those investments connect to what's happening in each local market.
Which Cities Spend the Most on Office Pantries?
Which Cities Spend the Most Per Employee?
Rank cities by cost per person per day, and the leaderboard changes. While monthly spend reflects the size of an office and its workforce, this metric takes headcount out of the equation to show which markets are investing the most in each employee’s daily experience.
Want to see how your market compares? Explore your city's pantry data in the Pantry Intelligence Index to benchmark local spending, uncover trends, and put your budget into perspective.
Office Pantry Spend by Industry
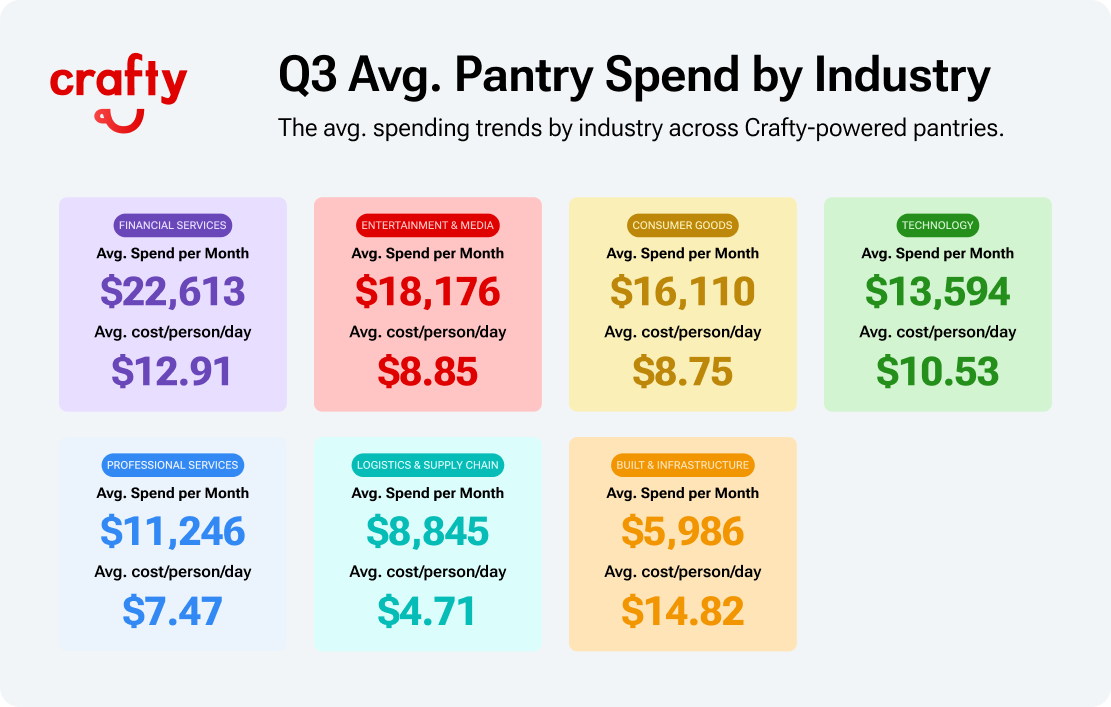
Across industries, AI is changing how companies operate, where they invest, and the talent they need to compete. The skills required for AI-exposed jobs are changing twice as fast as those in less-exposed roles. Financial firms are paying more for AI expertise, with 91% increasing compensation for employees with those skills, while technology companies are racing to build teams around AI. Each industry faces different pressures, but the priority is the same: attract specialized talent, keep them engaged, and create a workplace that supports their best work. Q3 pantry benchmarks show how those priorities translate into investment.
Which Industries Spend the Most on Office Pantries?
What Top Industries Stock in Their Pantries
- Markets & Trading: Fuel for High-Performance Teams
Trading revenue at the five largest US banks has doubled since 2023, raising the stakes for the specialized teams driving that growth. These workplaces are investing in convenient, high-quality options that fit demanding schedules. Bars lead the product mix, with Barebells, fresh fruit, Organic Valley milk, LaCroix, and Hint giving employees a mix of protein, hydration, and grab-and-go fuel. - Real Estate: Premium Hospitality on a Smaller Footprint
As real estate dealmaking picks up, offices are serving as hubs for agents, brokers, and property teams who spend much of their day on the move. Smaller onsite headcounts help explain the lower monthly budgets and higher investment per person. The priority is creating a welcoming space for employees dropping in between appointments and clients stopping by for meetings. Coffee leads the experience, with Big Shoulders, Organic Valley, Tazo tea, and Maison Perrier keeping the office ready for both. - AI & Data: Fuel for Work That Demands Focus
The number of AI-skilled tech workers across the US and Canada grew 45% in a year, intensifying competition for specialized talent. For teams spending long stretches coding, building models, and solving complex problems, convenient options that support energy and focus are a priority. That shows up in the pantry: protein inside Barebells and fairlife, while CELSIUS and ITO EN provide the caffeine fix, and LaCroix and Harmless Harvest coconut water give employees ways to stay hydrated throughout the day. - Energy & Utilities: Powering the AI Boom
AI's rapid growth is driving unprecedented electricity demand, putting pressure on energy companies to expand infrastructure and compete for the skilled workers needed to support it. In fact, competition for talent ranks among the industry's biggest workforce challenges. For teams managing critical infrastructure and demanding schedules, caffeine is a workplace staple. Coffee accounts for 49.2% of pantry spend, with Big Shoulders beans, Coffee-mate, nitro cold brew, and Bevi's caffeinated Energy Boost giving employees options to power through the day. - Advisory & Consulting: Built for Busy, Client-Facing Teams
As businesses race to adopt AI, consulting firms are seeing new demand for transformation expertise, with firms like PwC expanding hiring. For consultants juggling client meetings, project deadlines, and time on the road, the office is often a place to regroup between commitments. That makes quick, convenient options especially valuable. Snacks & Pantry accounts for 48.1% of spend, with Barebells offering protein between meals, HIPPEAS and Welch's Fruit Snacks providing easy grab-and-go options, and LaCroix keeping the fridge stocked for employees and visiting clients.
Across industries, employers are balancing the experience employees expect with the fuel they need to perform. A closer look at category spending reveals how that balance is shaping what companies stock and where pantry priorities are shifting.
Office Pantry Spend by Category
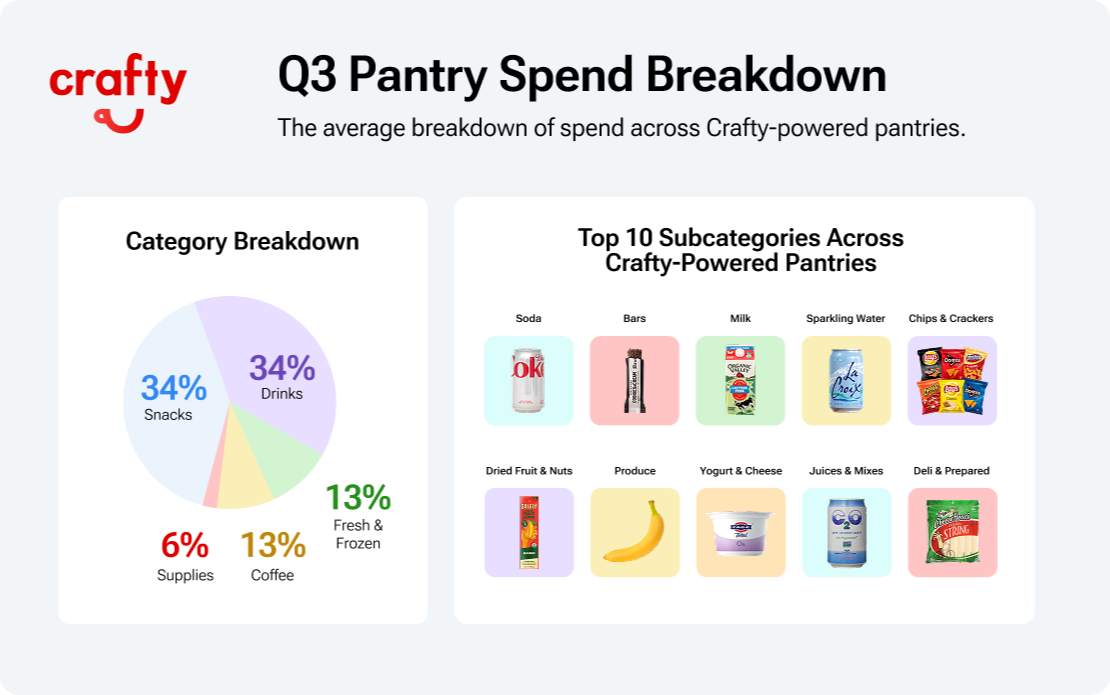
Beverages gained ground in Q3, nearly matching snacks for the largest share of pantry spending. But across the pantry, a bigger trend is taking shape. Employees are looking for products that serve a purpose, whether that's staying hydrated, getting more protein, maintaining energy, or finding something filling between meals. Those goals are influencing how employers build their lineups and where pantry dollars go.
How Does the Average Pantry Budget Split by Category?
- Snacks & Pantry: 34%
- Beverages: 34%
- Fresh & Frozen: 14%
- Coffee: 13%
- Supplies: 6%
Top 10 Office Pantry Subcategories
- Sodas
- Bars
- Milk & Alternatives
- Still & Sparkling Water
- Chips & Crackers
- Dried Fruit, Nuts & Trail Mix
- Produce
- Yogurt
- Juices & Mixers
- Deli & Prepared Foods
Q3 Category Takeaways: Beverages, Protein, and Snacking
- Beverages are becoming part of the performance toolkit: Drinks are increasingly serving specific needs, from hydration and nutrition to a caffeine boost. In fact, 68% of consumers sometimes choose a beverage instead of a snack. In Q3, beverages nearly overtook snacks, while iced coffee held steady as a workplace staple for energy. Juices also entered the top 10, led by C2O coconut water.
- Protein is becoming an everyday priority: Nearly half of US adults are trying to eat more protein, with growing interest in natural sources like eggs, meat, and cheese alongside bars and shakes. That demand is reflected in office pantries, where bars, milk, and yogurt rank among the top subcategories, while deli and prepared foods entered the top 10.
- Snacks are becoming more intentional: 55% of US shoppers eat three or more snacks daily, while GLP-1 use is reshaping what goes into those smaller eating occasions. In 2026, 48% of GLP-1 users reported buying more portion-controlled foods. In office pantries, deli and prepared foods entered the top 10, while dried fruit, nuts, and trail mix moved ahead of produce, offering more ways to build convenient, satisfying mini-meals.
- Everyday favorites are part of the routine: 2026 research shows that snacks play an important role in daily routines, providing comfort and enjoyment alongside nutrition and energy. That shows up in Crafty's rankings, where sodas, bars, and chips and crackers remain among the top five subcategories. As employers introduce more functional options, maintaining familiar favorites is just as important to creating a pantry experience employees look forward to.
The category rankings show how those priorities are changing the pantry mix. The individual product rankings reveal which brands and products are delivering on them.
Best-Selling Office Pantry Products in Q3 2026
The biggest story in Q3’s product rankings is consistency. Nearly every top-selling product held its spot from Q2, a sign of how much employees rely on familiar favorites to fuel their daily routines.
The few changes show where preferences are evolving. HIPPEAS Chickpea Puffs overtook SkinnyPop in popcorn and pretzels, Rishi took the lead in hot tea, and Emergen-C moved into the top spot for personal care.
Subcategory Rankings & Best Sellers
- Sodas: Diet Coke
- Bars: Barebells Cookies and Cream
- Milk & Alternatives: Organic Valley Organic Milk
- Still & Sparkling Water: LaCroix Pure
- Chips & Crackers: Frito-Lay Classic Mix Variety Pack
- Dried Fruit, Nuts & Trail Mix: Solely Fruit Jerky Mango
- Produce: Bananas
- Yogurt: Chobani Non-Fat Plain Greek Yogurt
- Juices & Mixers: C2O Pure Coconut Water
- Deli & Prepared Foods: Frigo Cheese Heads Original
- Sweets & Candy: UnReal Dark Chocolate Peanut Butter Cups
- Cold Tea: ITO EN Oi Ocha Unsweetened Green Tea
- Sports & Protein Drinks: fairlife Core Power Protein Shake
- Sweeteners & Creamers: Organic Valley Half and Half
- Flavored & Infused Water: Hint Watermelon
- Breakfast: Honey Nut Cheerios
- Energy Drinks: CELSIUS Sparkling Orange
- Kitchen & Dining Supplies: Bounty Paper Towels
- Popcorn & Pretzels: HIPPEAS Chickpea Puffs
- Cold Brew & Iced Coffee: La Colombe Cold Brew
- Coffee & Coffee Beans: Philz Coffee Tesora
- Jerky: Think Jerky Original Beef
- Cookies: Meiji Hello Panda Cookies
- Pods, Capsules & Instant: Nespresso Caffe Caramello
- Hot Tea: Rishi Tea
- Breads: Dave’s Killer Bread
- Condiments: Justin’s Classic Peanut Butter
- Spreads: Wholly Guacamole Classic
- BiBs & Fountain Refills: Coke Zero
- Frozen: Smucker’s Uncrustables
- Instant Meals: Del Monte Pineapple Chunks
- Kombucha: GT’s Synergy Kombucha
- Cleaning Products: Nespresso Recycling Bag (for Nespresso Pods)
- CO2 & Nitrogen: 5 Pound Nitrogen Tank (for Kegerators)
- Personal Care: Emergen-C Super Orange
- Event Essentials: World Centric Compostables
- Tea & Cocoa: Starbucks Hazelnut Cocoa
The takeaway for workplace teams is to build on what's already working. Protect the products employees reach for every day, then use emerging preferences to guide thoughtful additions and swaps.
Next, we'll look at how to turn these benchmarks into practical decisions for your own pantry.
How to Use Q3 Benchmarks in Your Office Pantry
The trends are clear. Now it's about putting them to work. The best pantry programs protect what employees already love while finding new ways to support their needs, stretch budgets, and get more value from every product.
- Keep hydration a priority year-round: Summer may be over, but hydration isn't going anywhere. Keep the staples employees love while finding easy ways to expand their options. Add electrolytes to your Bevi lineup, stock coconut water, or introduce functional beverages alongside everyday favorites. Explore water machines that make hydration convenient throughout the day.
- Stock versatile pantry options that deliver more: Build a pantry where employees can combine office snacks to meet their goals, whether that's more protein, gut health, or simpler ingredients. For example, Catalina Crunch cereal works as breakfast, a yogurt topping, or a standalone snack. Pair Greek yogurt with fruit and granola for protein and fiber, or crackers with cheese for a filling bite. These Snack Hacks create more ways to fuel the day without expanding your lineup.
- Use multiple signals to make smarter decisions: No single data source tells the full story. Consumption data shows what employees actually eat and what's going to waste. Employee voting reveals what they say they want to see next. Industry benchmarks show how your lineup compares with peers and where preferences are shifting. Bring all three together to protect favorites, identify gaps, and make product changes with confidence.
The goal is to turn what you're learning into a pantry that works harder for your people and your budget.
Office Pantry Benchmarks FAQ
How much do companies spend on office pantries?
In Q3 2026, offices spent an average of $15,551 per month on pantry programs, or $10.85 per person per day, based on Crafty data across the US and Canada. Costs vary by market and industry, with some offices spending significantly more.
What is cost per person per day for an office pantry?
The Q3 2026 average was $10.85. Cost per person per day is the average amount an office invests in each employee’s pantry experience for every day the office is open. It normalizes spend for office size, so teams of any headcount can compare.
How does the average office pantry budget break down?
In Q3 2026, Snacks & Pantry and Beverages each accounted for 34% of pantry spend, followed by Fresh & Frozen at 14%, Coffee at 13%, and Supplies at 6%. By units delivered, Sodas, Bars, and Milk & Alternatives were the most popular subcategories.
How to Benchmark Your Own Pantry Program
Q3's benchmarks show that the best pantry strategies balance the experience employees love with products that help them perform. That doesn't require a complete overhaul. Small, intentional changes to your hydration lineup, versatile snack options, and everyday staples can make a meaningful difference.
The key is knowing where to invest. Cost per person per day puts spending into perspective, while consumption data and employee feedback reveal what's working and where there's room to improve. Together, they give workplace teams the confidence to optimize every dollar while protecting the products employees count on.
Explore the Pantry Intelligence Index to benchmark your program and find your next opportunity to improve.
Related Resource

Blog
What Texas Offices Want in the Pantry, From Dallas to Austin and Houston
October 26, 2026
Blog
San Francisco Office Pantry Benchmarks 2026 (Data Through September)
October 26, 2026

Blog
Your Office Guide to the Types of Protein in Snacks
October 23, 2026

Blog
Equipment Guide: The Best Office Coffee Machines for Your Team
October 22, 2026

Blog
Best Low Carb Snacks for the Office Pantry
October 21, 2026

Blog
Office Pantry Services in Texas: How Crafty Is Growing Across Dallas, Austin & Houston
October 15, 2026

Blog
What Makes Fruit “Office-Ready”? From Farm Selection to Delivery Standards
October 15, 2026
Blog
The Procurement Guide to Evaluating Office Pantry Providers
October 14, 2026

Blog
Equipment Guide: Sparkling Water Machines for the Office
October 14, 2026