min read
July 28, 2026
Q2 2026 Office Pantry Benchmarks
The pantry programs outperforming in 2026 share one trait: they're built on data, not instinct.

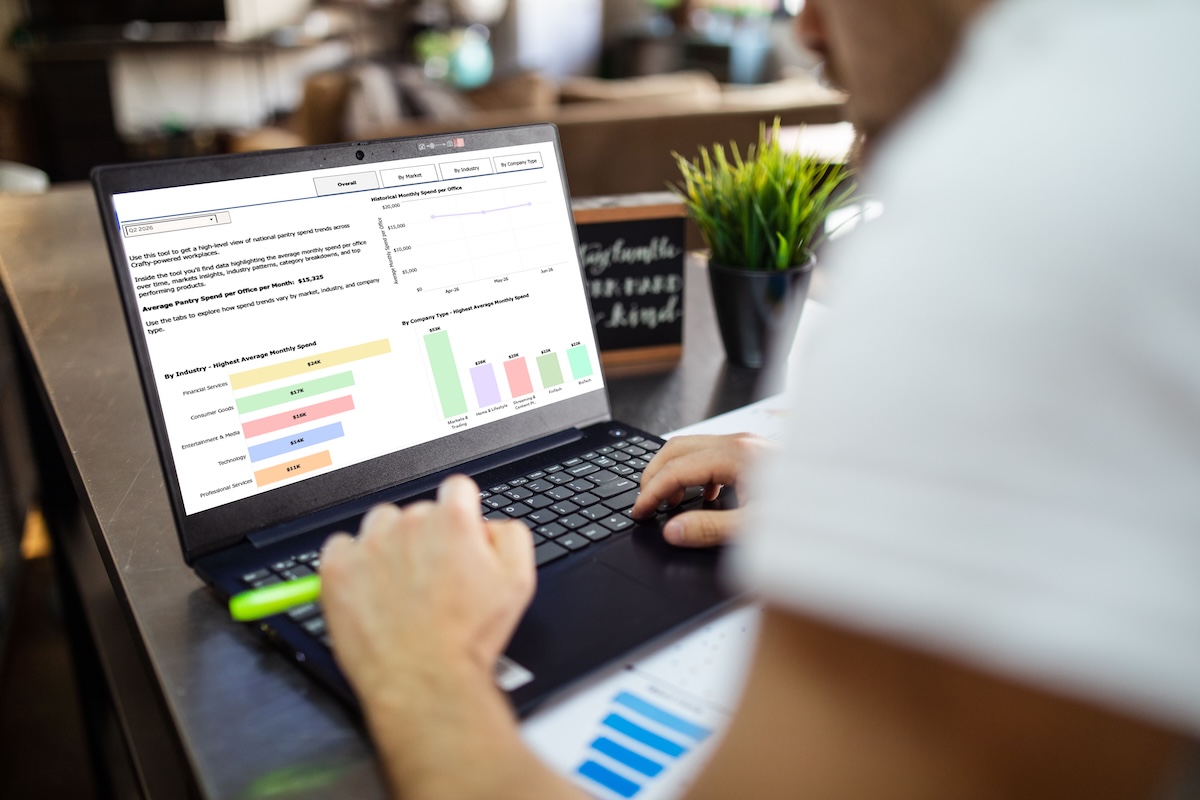
Throughout the first half of 2026, workplace leaders are operating in an environment where expectations keep rising, budgets are tightening, and measurable impact is expected.
Across the country, organizations continue to invest in food and beverage programs that help attract talent, strengthen retention efforts, and support employee performance. At the same time, leadership needs to be confident that these programs are operating as efficiently as possible.
As a result, pantry programs require a more strategic approach than ever before. Managing them at the level leadership teams require is no longer possible through instinct, spreadsheets, or occasional check-ins alone. Workplace teams need the visibility, automation, and real-time insights to understand what's happening across their program, optimize quickly as employee behavior changes, and ensure every dollar is working as hard as possible.
The Q2 benchmarks below provide a snapshot of how workplace pantry programs are evolving across markets, industries, and company types. Together, they reveal where organizations are investing, how employee preferences are changing, and the strategies workplace leaders are using to maximize every dollar.
This analysis is powered by the Crafty Pantry Intelligence Index. While Crafty clients have long had access to their own quantitative consumption data and qualitative employee feedback, today we're making broader market intelligence available to everyone.
Explore what we're seeing across Crafty-powered pantries in Q2 2026, then use the Pantry Intelligence Index to see how your pantry compares.

At a Glance: Office Pantry Benchmarks
Throughout Q2, workplace teams continued navigating the same core tension. AI is accelerating productivity while raising expectations around operational performance. At the same time, organizations are competing for the highly skilled talent needed to unlock those efficiencies, and as pantry programs play a more visible role in the workplace experience, leadership is paying closer attention to what they cost and what they deliver.
Q2 Pantry Spend at a Glance:
- Average monthly pantry spend: $15,325 per office
- Highest-spend month: April at $15,722 per office
Key Office Pantry Insights
- Spending follows a seasonal rhythm: Pantry investment peaks during the spring and fall, when attendance and activities are more frequent, while winter and summer tend to bring more leveled spending due to holidays, vacations, and changing schedules.
- More organizations prioritize experience, but optimization still leads: We're seeing more workplaces prioritize a robust employee experience despite budget pressures, with a 21% increase in the percentage of clients choosing a Stock It strategy compared to last quarter. That said, more than 80% of Crafty clients still make budget the priority by choosing either an Optimize It or Save It strategy for their pantry program. Here's what each pantry budget approach means:
- Stock It: Prioritize product availability, even if it means spending slightly above budget.
- Optimize It: Deliver the best possible employee experience while staying on budget through smarter purchasing and continuous optimization.
- Save It: Reduce spend wherever possible while maintaining a positive employee experience.
- Employee feedback is becoming a strategic data source: With direct insights from more than 300,000 employees, workplace teams are beginning to pair qualitative employee feedback with quantitative consumption data, creating a more complete view of pantry performance.
Organizations are balancing employee experience with financial discipline while relying on richer data to guide decisions. The following market insights reveal where those priorities are having the greatest impact and the trends shaping office pantries nationwide.

Where It's Happening: City Benchmarks
Where companies invest reflects where they're competing. While local economies are shaped by different industries and trends, the cities investing most in pantry programs share one thing in common: employers see the workplace as a strategic tool for attracting, supporting, and retaining employees.
Top Cities Investing in Pantry
- Las Vegas: $36,833 per office/month
Record employment and one of the nation's fastest-growing labor markets continue to fuel pantry investment in Las Vegas. As the region diversifies beyond hospitality into professional services, healthcare, technology, and logistics, employers are investing more heavily in workplace experiences to compete for talent. - Dallas: $23,506 per office/month
Continued corporate relocations, headquarters expansions, and Texas' business-friendly tax environment continue to strengthen Dallas-Fort Worth's economy. Growth across financial services, AI, technology, and logistics is increasing competition for talent, driving continued investment in workplace experiences. - Orlando: $21,445 per office/month
Orlando jumped into the No. 3 spot this quarter as one of the nation's fastest-growing metro areas. That momentum is fueling expansion across industries like healthcare, technology, aerospace, and financial services, making employee experience an increasingly important advantage for attracting talent. - Chicago: $19,739 per office/month
Chicago is entering what local business leaders describe as a "proof economy," where AI is changing how employers evaluate and compete for talent. As hiring becomes more skills-driven, workplace experiences are playing a larger role in attracting and retaining high-performing employees. - New York City: $16,579 per office/month
As AI companies expand across New York, they're fueling renewed demand for office space and helping reshape the city's commercial real estate market. As employers build workplaces designed for collaboration and innovation, employee amenities remain a strategic part of that investment.
Fastest-Growing Cities in Pantry Investment
- Pittsburgh: $12,517 per office/month (+53% QoQ)
Continued public investment is fueling development across Pittsburgh, creating new opportunities for private sector organizations being brought in to support these projects. Employers are responding by investing more in workplace experiences to attract and retain top talent. - Philadelphia: $10,172 per office/month (+35% QoQ)
Renewed momentum across healthcare, life sciences, manufacturing, and shipbuilding is creating a more competitive labor market. As employers work to differentiate themselves, investment in workplace experiences continues to rise. - Charlotte: $8,263 per office/month (+35% QoQ)
Once defined primarily by banking, the region is expanding into healthcare, life sciences, and innovation while continuing to outperform most major metros in job growth. The result is a more competitive market where the quality of the workplace increasingly influences talent decisions. - Denver: $13,738 per office/month (+35% QoQ)
Job losses and cautious hiring have reshaped Denver’s labor market, while office attendance continues to trail every other city in the national index. In that environment, the workplace experience carries more weight in giving employees a reason to come in. - Los Angeles: $10,115 per office/month (+7% QoQ)
Los Angeles' office economy is becoming more selective. As hiring slows and AI enables employees to do more, companies are focusing less on adding headcount and more on maximizing the value of the teams they already have.
Whether organizations are navigating rapid growth, AI transformation, or a changing labor market, the workplace is becoming a more strategic investment. Pantry programs help companies build an employee experience that stands out in a competitive market and becomes part of the reason people stay.

Who's Driving the Shift: Industry Benchmarks
The highest-spending sectors are often making significant investments in technology, growth, and specialized talent at the same time, raising the stakes for both attracting the right people and creating a workplace they value once they arrive.
Pantry Spend Benchmarks by Industry and Company Type
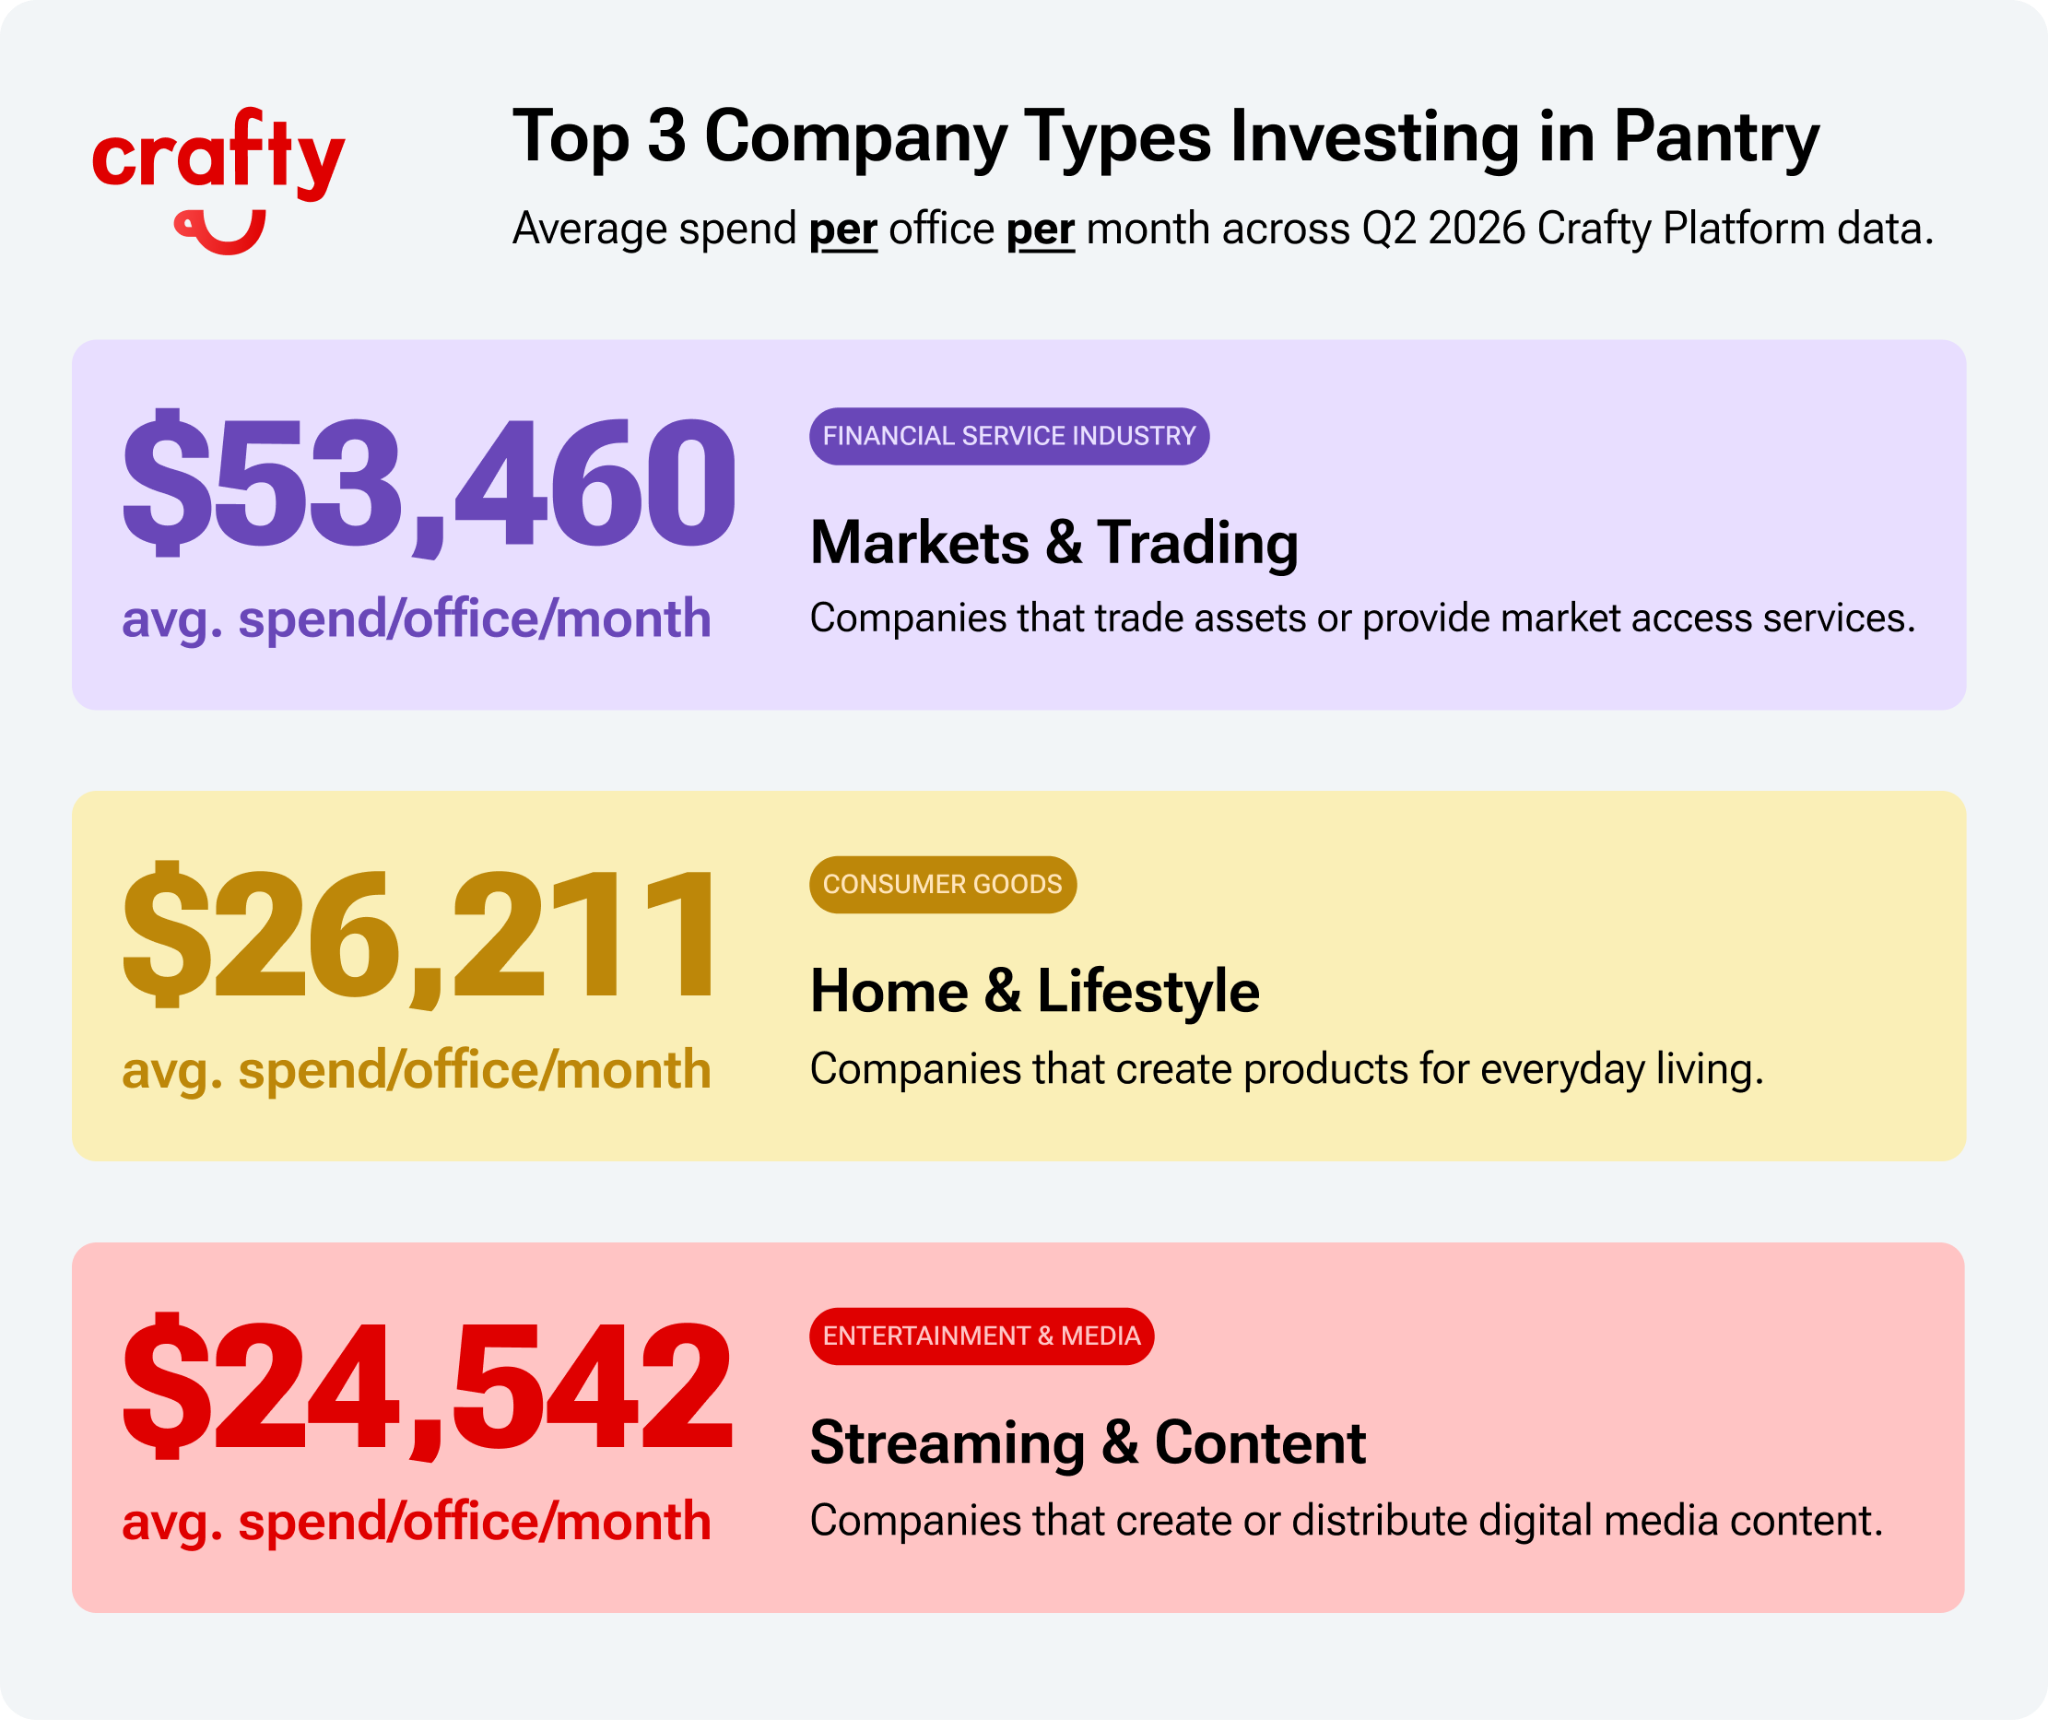
- Financial Services: $23,881/office/month
- Banking & Advisory: $6,009/office/month
- FinTech: $21,918/office/month
- Insurance: $20,243/office/month
- Investment Firms: $19,963/office/month
- Markets & Trading: $53,460/office/month
- Consumer Goods: $17,093/office/month
- Food & Beverage: $17,260/office/month
- Home & Lifestyle: $26,211/office/month
- Personal Care: $5,237/office/month
- Entertainment & Media: $16,103/office/month
- Gaming & Media Tech: $6,174/office/month
- Sports: $17,267/office/month
- Streaming & Content: $24,542/office/month
- Technology: $13,596/office/month
- AI & Data: $12,286/office/month
- BioTech: $21,531/office/month
- Consumer Platforms: $17,692/office/month
- SaaS: $10,051/office/month
- Professional Services: $10,783/office/month
- Advisory & Consulting: $12,965/office/month
- Architecture & Engineering: $4,986/office/month
- Associations: $5,742/office/month
- Legal: $10,912/office/month
- Marketing Services: $5,340/office/month
- Built Infrastructure & Environment: $5,444/office/month
- Clean Energy: $8,476/office/month
- Construction: $9,216/office/month
- Energy & Utilities: $7,831/office/month
- Real Estate: $4,345/office/month
- Logistics & Supply Chain: $10,606/office/month
- Logistics & Freight Services: $9,100/office/month
- Supply Chain Infrastructure: $13,618/office/month
The largest investments also point to a broader shift in where valuable talent is going. AI-related roles are spreading well beyond traditional technology companies as most jobs labeled as AI-related in the US are now outside the traditional technology sector. As more industries build their own technical capabilities, they are competing for the same people and investing in both headcount and the experience surrounding it.
Key Industry Takeaways:
- Markets & Trading: Markets never stop, and neither do the teams behind them. As firms invest more heavily in AI and specialized talent, they're also investing in workplace experiences that help employees sustain performance through long, high-intensity days. That shift is reflected in our pantry data, where better-for-you snacks and beverages with more protein and functional ingredients continue gaining share across many categories.
- FinTech: As AI lowers the barrier to building software, fintech companies are competing for a new generation of hybrid talent that combines financial expertise with technical and AI skills. These employees command higher salaries and have no shortage of opportunities, making the workplace a critical part of the overall value proposition. Our Q2 pantry data reflects that investment, with sparkling water leading growth alongside bars, fresh produce, and better-for-you snacks that support high-performing teams throughout the day.
- Streaming & Content: Creating content is becoming easier, but earning attention is becoming harder. As AI accelerates production, media companies are investing in environments that help creative teams collaborate, experiment, and develop ideas that stand out in an increasingly crowded market. Our pantry data reflects the same balance, with employees prioritizing hydration and better-for-you options while still reaching for nostalgic favorites and classic treats.
- BioTech: As biotech companies shift to leaner teams, every hire carries more strategic weight. Rather than growing headcount aggressively, organizations are investing more intentionally in the specialized scientists, researchers, and clinical leaders they already have. Supporting those teams means creating workplaces that can sustain long days of research and development, with fresh produce ranking among the most popular pantry categories alongside bars, while energy and sports drinks see stronger demand in these workplaces than the average pantry.
- Personal Care: As beauty brands rebuild with leaner, more intentional teams, supporting employee performance has become just as important as growing headcount. While coffee remains deeply embedded in the workplace culture, companies are expanding beyond caffeine alone, investing more heavily in fresh food and hydration to support employees throughout the workday.
- Construction: The AI infrastructure boom has intensified competition across the construction industry, with data center projects reshaping hiring and stretching teams across every stage of the business. As construction firms compete for talent while managing increasingly complex project pipelines, they're investing more intentionally in the workplace experience. Coffee continues to define the office culture, but pantry programs are expanding beyond the coffee station, with growing investment in bars and snacks that keep employees fueled throughout demanding workdays.

How It Breaks Down: Category Insights
Q2 spending followed a familiar seasonal pattern, with a larger share of pantry budgets shifting into beverages as temperatures climbed.
Category Allocation (% of total pantry spend):
- Snacks: 35%
- Beverages: 33%
- Fresh & Frozen: 14%
- Coffee: 13%
- Supplies: 6%
Classic office staples like soda, sparkling water, and coffee remained pantry essentials, while categories like cold tea and sports & protein drinks saw growth as employees increasingly looked for functional hydration. On the snack side, bars, produce, and yogurt continued to gain ground alongside a resurgence of nostalgic favorites like cookies, popcorn, and sweets.
Top 10 Subcategories (% of total pantry products delivered):
- Sodas
- Bars
- Milk
- Still & Sparkling Water
- Chips & Crackers
- Produce
- Dried Fruit & Nuts
- Yogurt & Cheese
- Sweets & Candy
- Cold Tea

Growing Subcategories in Q2 (compared to last year):
- Cold Brew & Iced Coffee: +216%
- Instant Meals: +187%
- Popcorn & Pretzels: +183%
- Sports & Protein Drinks: +173%
- Pods, Capsules & Instant: +161%
- Cookies: +156%
- Sweets & Candy: +142%
Understanding where spending is shifting is only the first step. The real opportunity comes from identifying the products driving that growth, turning broad category trends into practical decisions for your pantry.
The Top Pantry Products in Q2 2026
Looking at top products adds an important layer of context to the category trends. It shows where employee routines remain remarkably consistent and where preferences are beginning to evolve. While functional products continue to gain momentum, many of the products employees rely on every day remain unchanged. Understanding that balance helps workplace teams make smarter merchandising decisions instead of chasing every new trend.
Q2 Subcategory Rankings & Best Sellers
- Sodas: Diet Coke
- Bars: Barebells Cookies and Cream
- Milk & Alternatives: Organic Valley Original Whole Milk
- Still & Sparkling Water: LaCroix - Pure
- Chips & Crackers: Frito-Lay Classic Mix Variety Pack
- Produce: Bananas
- Dried Fruit: Soley Fruit Mango Jerky
- Yogurt: Chobani Non-Fat Plain Yogurt
- Sweets & Candy: UnReal Dark Chocolate Peanut Butter Cups
- Cold Tea: ITO EN Oi Ocha Unsweetened Green Tea
- Deli & Prepared: Frigo Cheese Heads Original
- Juices & Mixes: C2O Pure Coconut Water
- Sweeteners & Creamers: Organic Valley Half and Half
- Sports & Protein Drinks: fairlife Core Power Protein Shake Chocolate
- Flavored & Infused Water: Hint Blackberry
- Breakfast: Honey Nut Cheerios
- Energy Drinks: CELSIUS Sparkling Orange
- Kitchen & Dining Supplies: Bounty Paper Towels
- Popcorn & Pretzels: SpinnyPop Original
- Cold Brew & Iced Coffee: La Colombe Cold Brew
- Jerky: Think Jerky Original Beef
- Coffee & Coffee Beans: Philz Coffee Tesora (Medium Roast)
- Cookies: Meiji Hello Panda Chocolate Cookies
- Coffee Pods: Nespresso Espresso Forte
- Hot Tea: Bigelow Tea Company Classic Green Tea
- Breads: Dave's Killer Bread 21 Whole Grains and Seeds
- Spreads: Wholly Gauacamole Mini Cups
- Condiments: Justin's Classic Peanut Butter
- Frozen: Smucker's Uncrustables Peanut Butter and Strawberry
- Bibs & Fountain: Coke Zero
- Instant Meals: Del Monte Pineapple Chunks
- Cleaning Products: Nespresso Recycling Bag
- Kombucha: GT Kombucha Synergy
- CO2 & Nitrogen: CO2 Tank
- Personal Care: Recyclable Facial Tissues
- Event Essentials: Modelo Especial Tap
Use these rankings as a guide for where to evolve your pantry. Preserve the products that anchor daily routines while looking for opportunities to introduce function where employee demand is already growing. The goal isn't to replace Diet Coke with a protein shake or chips with a protein bar. It's to build a pantry that supports performance by giving employees both the products they depend on and the products they're increasingly choosing.
Market Trends and How to Apply to Your Pantry
The strongest pantry decisions come from understanding both what's happening inside your workplace and what's shaping employee preferences outside of it. Comparing broader food and beverage trends with the products gaining momentum across Crafty's network helps identify which shifts are worth acting on and where small changes can have the biggest impact.
- Functional beverages are becoming the new standard:
As the global functional beverage market climbs toward $245.8 billion, consumers are seeking convenient ways to support energy, hydration, and recovery throughout the day. Workplace pantries are following suit, with protein drinks, cold teas, and other functional beverage categories growing even if they aren't stocked in the same quantities as the classics.- Pantry play: Stock functional options in smaller quantities, position them just below eye level so they are available but not the default to manage consumption, and therefore, budget.
- The rise of GLP-1 is reshaping workplace eating habits:
Nearly 1 in 5 US adults now report using a GLP-1 medication, and that shift is changing what employees look for throughout the workday. Instead of eating a few large portions throughout the day, many are choosing smaller, nutrient-dense snack and beverage options that help them hit their protein, fiber, hydration, and electrolyte goals.- Pantry play: Build GLP-1-friendly pantry options into every category. Invest in protein shakes, bars, and Greek yogurt for protein, use fresh produce, dried fruit, and nuts to boost fiber, and leverage bulk beverage solutions like Bevi for hydration and electrolytes.
- Employees are becoming more ingredient-conscious.
Nearly 6 in 10 consumers read nutrition labels before trying a new product, paying close attention to added sugars, artificial dyes, preservatives, and ingredients. We're seeing that same shift in workplace pantries, with selections across categories such as dried fruit, sweets and candy, and juices trending toward cleaner labels.- Pantry play: You don't need to have a totally clean pantry. Don't take away the Diet Coke from people; they'll revolt. Instead, add a few thoughtful options across a handful of categories like a low-sugar sweet option, a clean dried fruit or nut option, or a soda or energy drink that has minimal additives, sugar, and no dyes.
What’s Next: Evolving Your Pantry Strategy
The best pantry decisions in 2026 won’t come from overhauling everything; they’ll come from making the right changes. Workplace teams no longer have to guess which trends are worth acting on or make broad changes based on the loudest requests. Instead, they can use data to make small improvements that will yield the biggest impact.
Whether that's introducing a few functional beverages, investing more in fresh produce, or adding a cleaner, low-sugar sweet treat, the next generation of pantry programs will continue to anchor daily routines while evolving in ways that employees value, leadership can justify, and teams can continuously optimize.
Dive deeper into the data inside the Pantry Intelligence Index.
Related Resource

Blog
Best California Snack and Coffee Brands to Stock in Your Office Pantry
September 10, 2026
Blog
Office Equipment Guide: Drip Coffee Machines for the Office
September 10, 2026

Blog
Celebrate Halloween at Work: Breakroom Snacks, Activities, Decor, & More
September 9, 2026
Blog
October Holidays for Work: Breakroom Snack Celebrations
September 9, 2026

Blog
Best Chicago Snack and Coffee Brands to Stock in Your Office Pantry
September 2, 2026
Blog
Office Snack Scoop Episode 1 Takeaways: Fiber, Flavormaxxing, and the Beverage Boom
September 1, 2026
Blog
Hispanic Heritage Month at Work: Office Snack Ideas & LatinX-Owned Brands to Try
September 1, 2026

Blog
Fall Office Breakroom Ideas: Trends, Flavors, and Easy Swaps
August 26, 2026
News
Crafty Unveils 2026 Summer Platform Release to Give Workplace Teams More Context, Control, and Convenience
August 21, 2026