min read
May 11, 2026
Q1 2026 Office Pantry Benchmarks
The next evolution of the workplace isn’t defined by how much companies spend, it’s defined by how effectively they spend it.

In 2025, companies were in experimentation mode. They tested new tools, new workplace strategies, and new approaches to employee experience to see what actually made an impact. Meanwhile, employees were doing the same. Rethinking and adjusting how they worked, how they spent, and how they fueled their day.
In 2026, the focus has shifted from experimentation to performance.
Companies and employees alike are operating with greater intention and stronger discipline. For some organizations, budgets are expanding alongside growth and hiring. For others, new financial pressures are forcing workplace teams to do more with less. Across both realities, expectations are higher, and every decision carries more weight.
What we’re seeing across the market is that many office pantry programs have been managed reactively; built on instinct, limited visibility, and one-off decisions. That model can’t keep pace with today’s demands, where every dollar is scrutinized and expected to perform.
In response, workplace leaders are shifting toward more structured, data-driven programs; rethinking not just what goes on the shelf, but how decisions are made and measured to drive the greatest impact, whether they are scaling investment or optimizing against tighter financial targets.
Here’s what we’re seeing across Crafty-powered pantries in Q1 2026.
At a Glance: Office Pantry Benchmarks
Office pantry spending in Q1 tells a story of greater discipline and intention.
While some companies increased investment to support growth and talent competition, others faced tighter financial guidance and renewed pressure to optimize spend. Across both groups, companies are getting sharper about how they invest, focusing on maximizing impact, improving efficiency, and delivering better office experiences.
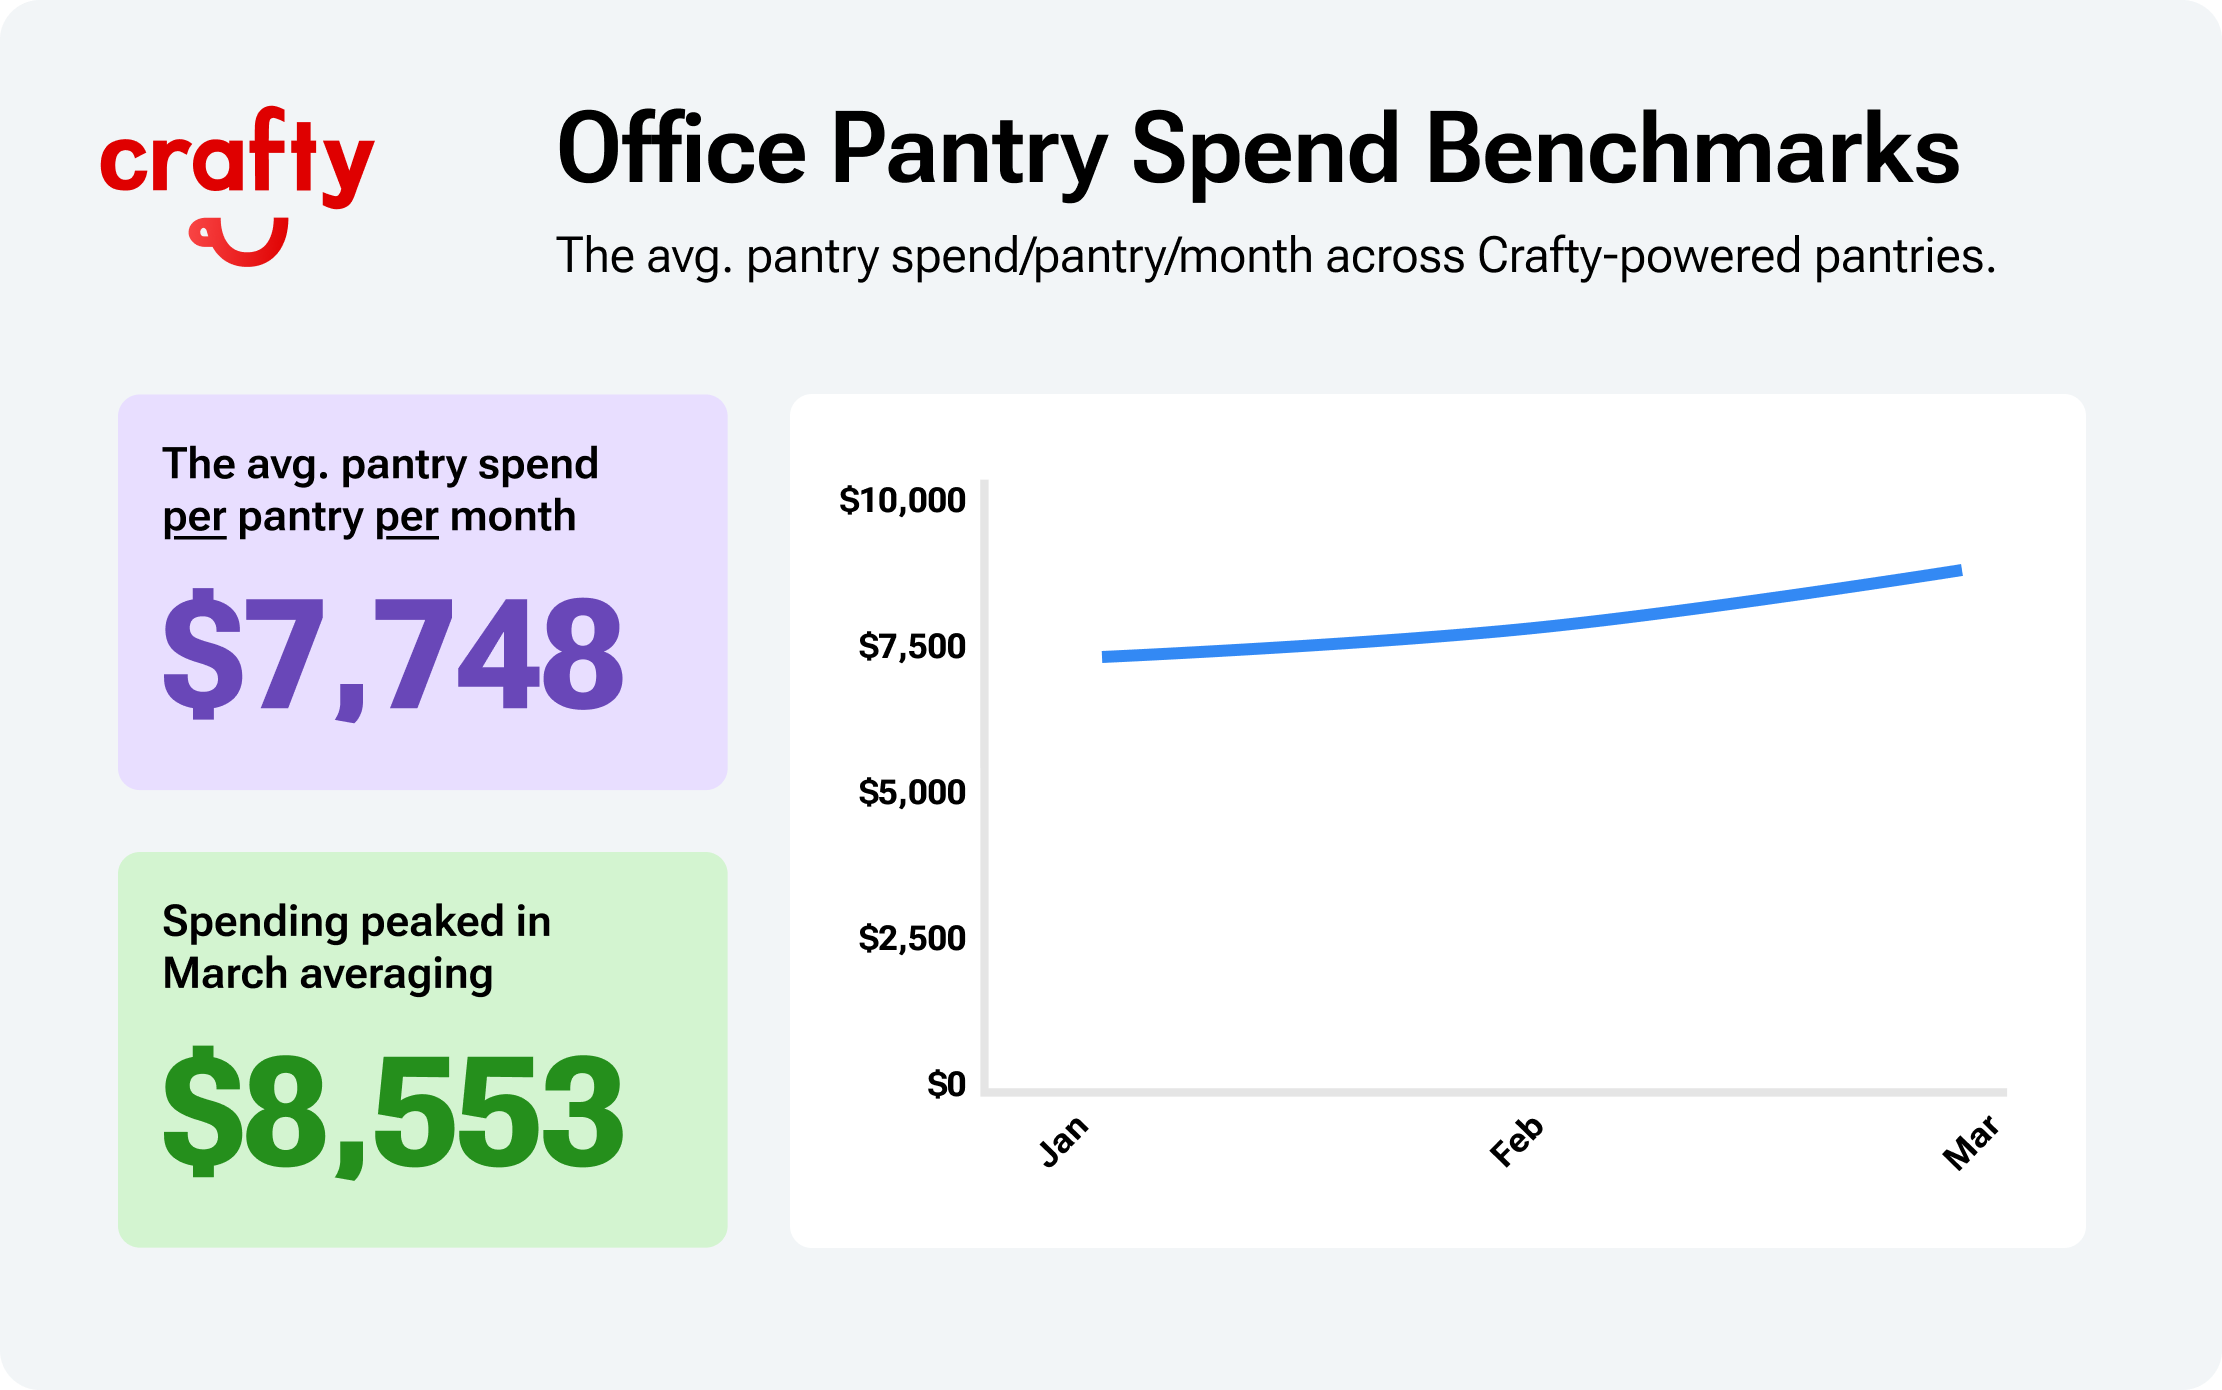
Office Pantry Spend for Q1 2026
- Spend ramped up as the quarter progressed, with March coming in at an average of $8,553
- The average pantry spent $7,748 per month, which was on pace with Crafty's 2025 data at $8,081 per month.
Overall pantry spend remained relatively consistent with 2025 levels, but that stability masks a widening split between companies increasing investment and those being asked to optimize against leaner budgets.Approaches like stocking based on instinct or responding to one-off requests break down quickly when every dollar is under scrutiny.
Without clear visibility into what is being consumed and when, it becomes nearly impossible to manage seasonality, predict demand, or prevent waste. That is why Crafty clients turned to a solution built on data and technology to bring structure and control to what has traditionally been a reactive function.
Key Pantry Spend Insights
- Pantry spend continues to follow a seasonal curve, with lower investment at the start of the year and ramping through spring, summer, and early fall.
- There has been a 27% YoY increase in companies investing $500,000+ annually in their pantry program.
- More pantry programs are prioritizing optimization and cost control, with “Save It” budget mindsets growing from 15% in 2025 to 21% in Q1 2026.
- A growing share of companies are explicitly prioritizing cost control. The goal is not eliminating pantry investment, but managing it with greater precision and accountability.
What we’re seeing is a shift toward more intentional program management. With the right tooling, companies can plan around seasonal usage patterns, identify what employees consistently reach for or don't, and adjust assortments quickly to save dollars. Instead of over-ordering in slower months or missing demand in peak periods, they are getting smarter about aligning spend to actual behavior. The result is a hyper-focused pantry that attracts talent without increasing overall investment in product or in resources.
Pantry Investment by Company Annual Spend Tier
The differences between pantry investment tiers reflect how companies are approaching talent, workplace expectations, and operational strategy. Organizations operating in highly competitive industries and talent markets are investing more aggressively in workplace experience to attract and retain employees, while others are placing greater emphasis on efficiency and tighter allocation of resources without eliminating variety or wellness-focused offerings.
- $500,000+ Annual Pantry Investment | Avg. $10,236/pantry/month:
Companies in highly competitive talent markets are investing heavily in pantry programs to support recruiting and retention, offering broader variety, premium products, and more functional snacks and beverages that align with rising employee expectations. - $150,000–$499,999 Annual Pantry Investment | Avg. $7,103/pantry/month:
These companies are balancing employee expectations with operational discipline, maintaining strong variety and wellness-focused options while using data to optimize assortments and manage spend more efficiently. - $60,000–$149,999 Annual Pantry Investment | Avg. $3,742/pantry/month:
These programs take a very targeted approach, focusing pantry spend on the products and categories that power consistent routines across their employee base and using data to refine that assortment in the smartest possible way.
Where It's Happening: City Benchmarks
In Q1 2026, spend is not just concentrated in the typical hub cities; it is expanding into high-growth markets where competition for talent, real estate, and presence is intensifying.
Top Cities Investing in Pantry
- Las Vegas: Avg. $12,009/pantry/month
A market in transition, Las Vegas is seeing increased investment in innovation and job creation as it diversifies beyond hospitality. As new industries enter the region, companies are using workplace experience to attract talent and establish a strong presence. - Dallas: Avg. $10,352/pantry/month
The Dallas–Fort Worth area has become the top destination for corporate headquarters relocations in the U.S., bringing a wave of new companies and employees into the market. These offices are being built to compete quickly, using pantry programs as a scalable way to deliver immediate value. - Chicago: Avg. $9,726/pantry/month
Chicago remains a critical central hub for national business operations, with strong representation across finance, consulting, and logistics. - Orlando: Avg. $9,131/pantry/month
Florida continues to attract businesses due to its tax advantages, lower operating costs, and population growth, making Orlando a key destination for expansion. - San Francisco Bay Area: Avg. $8,620/pantry/month
With the AI boom driving competition for technical talent, Bay Area companies are continuing to invest in workplace experience to attract and retain high-skill employees. - New York City: Avg. $8,084/pantry/month
New York is seeing renewed momentum in financial services and fintech, alongside a rebound in premium office demand. High-quality buildings are outperforming as companies invest in amenities and experience to draw employees back.
Across all of these markets, the pattern is clear. Pantry investment follows business movement and talent concentration. Companies expanding into new regions and those reinforcing their presence in established hubs are using the pantry as a practical, scalable way to compete.
Who's Driving the Shift: Industry Benchmarks
Pantry investment is becoming a direct reflection of performance. In this last quarter, the industries investing the most in their office pantries are the ones under the greatest pressure to attract, retain, and sustain high-performing talent.
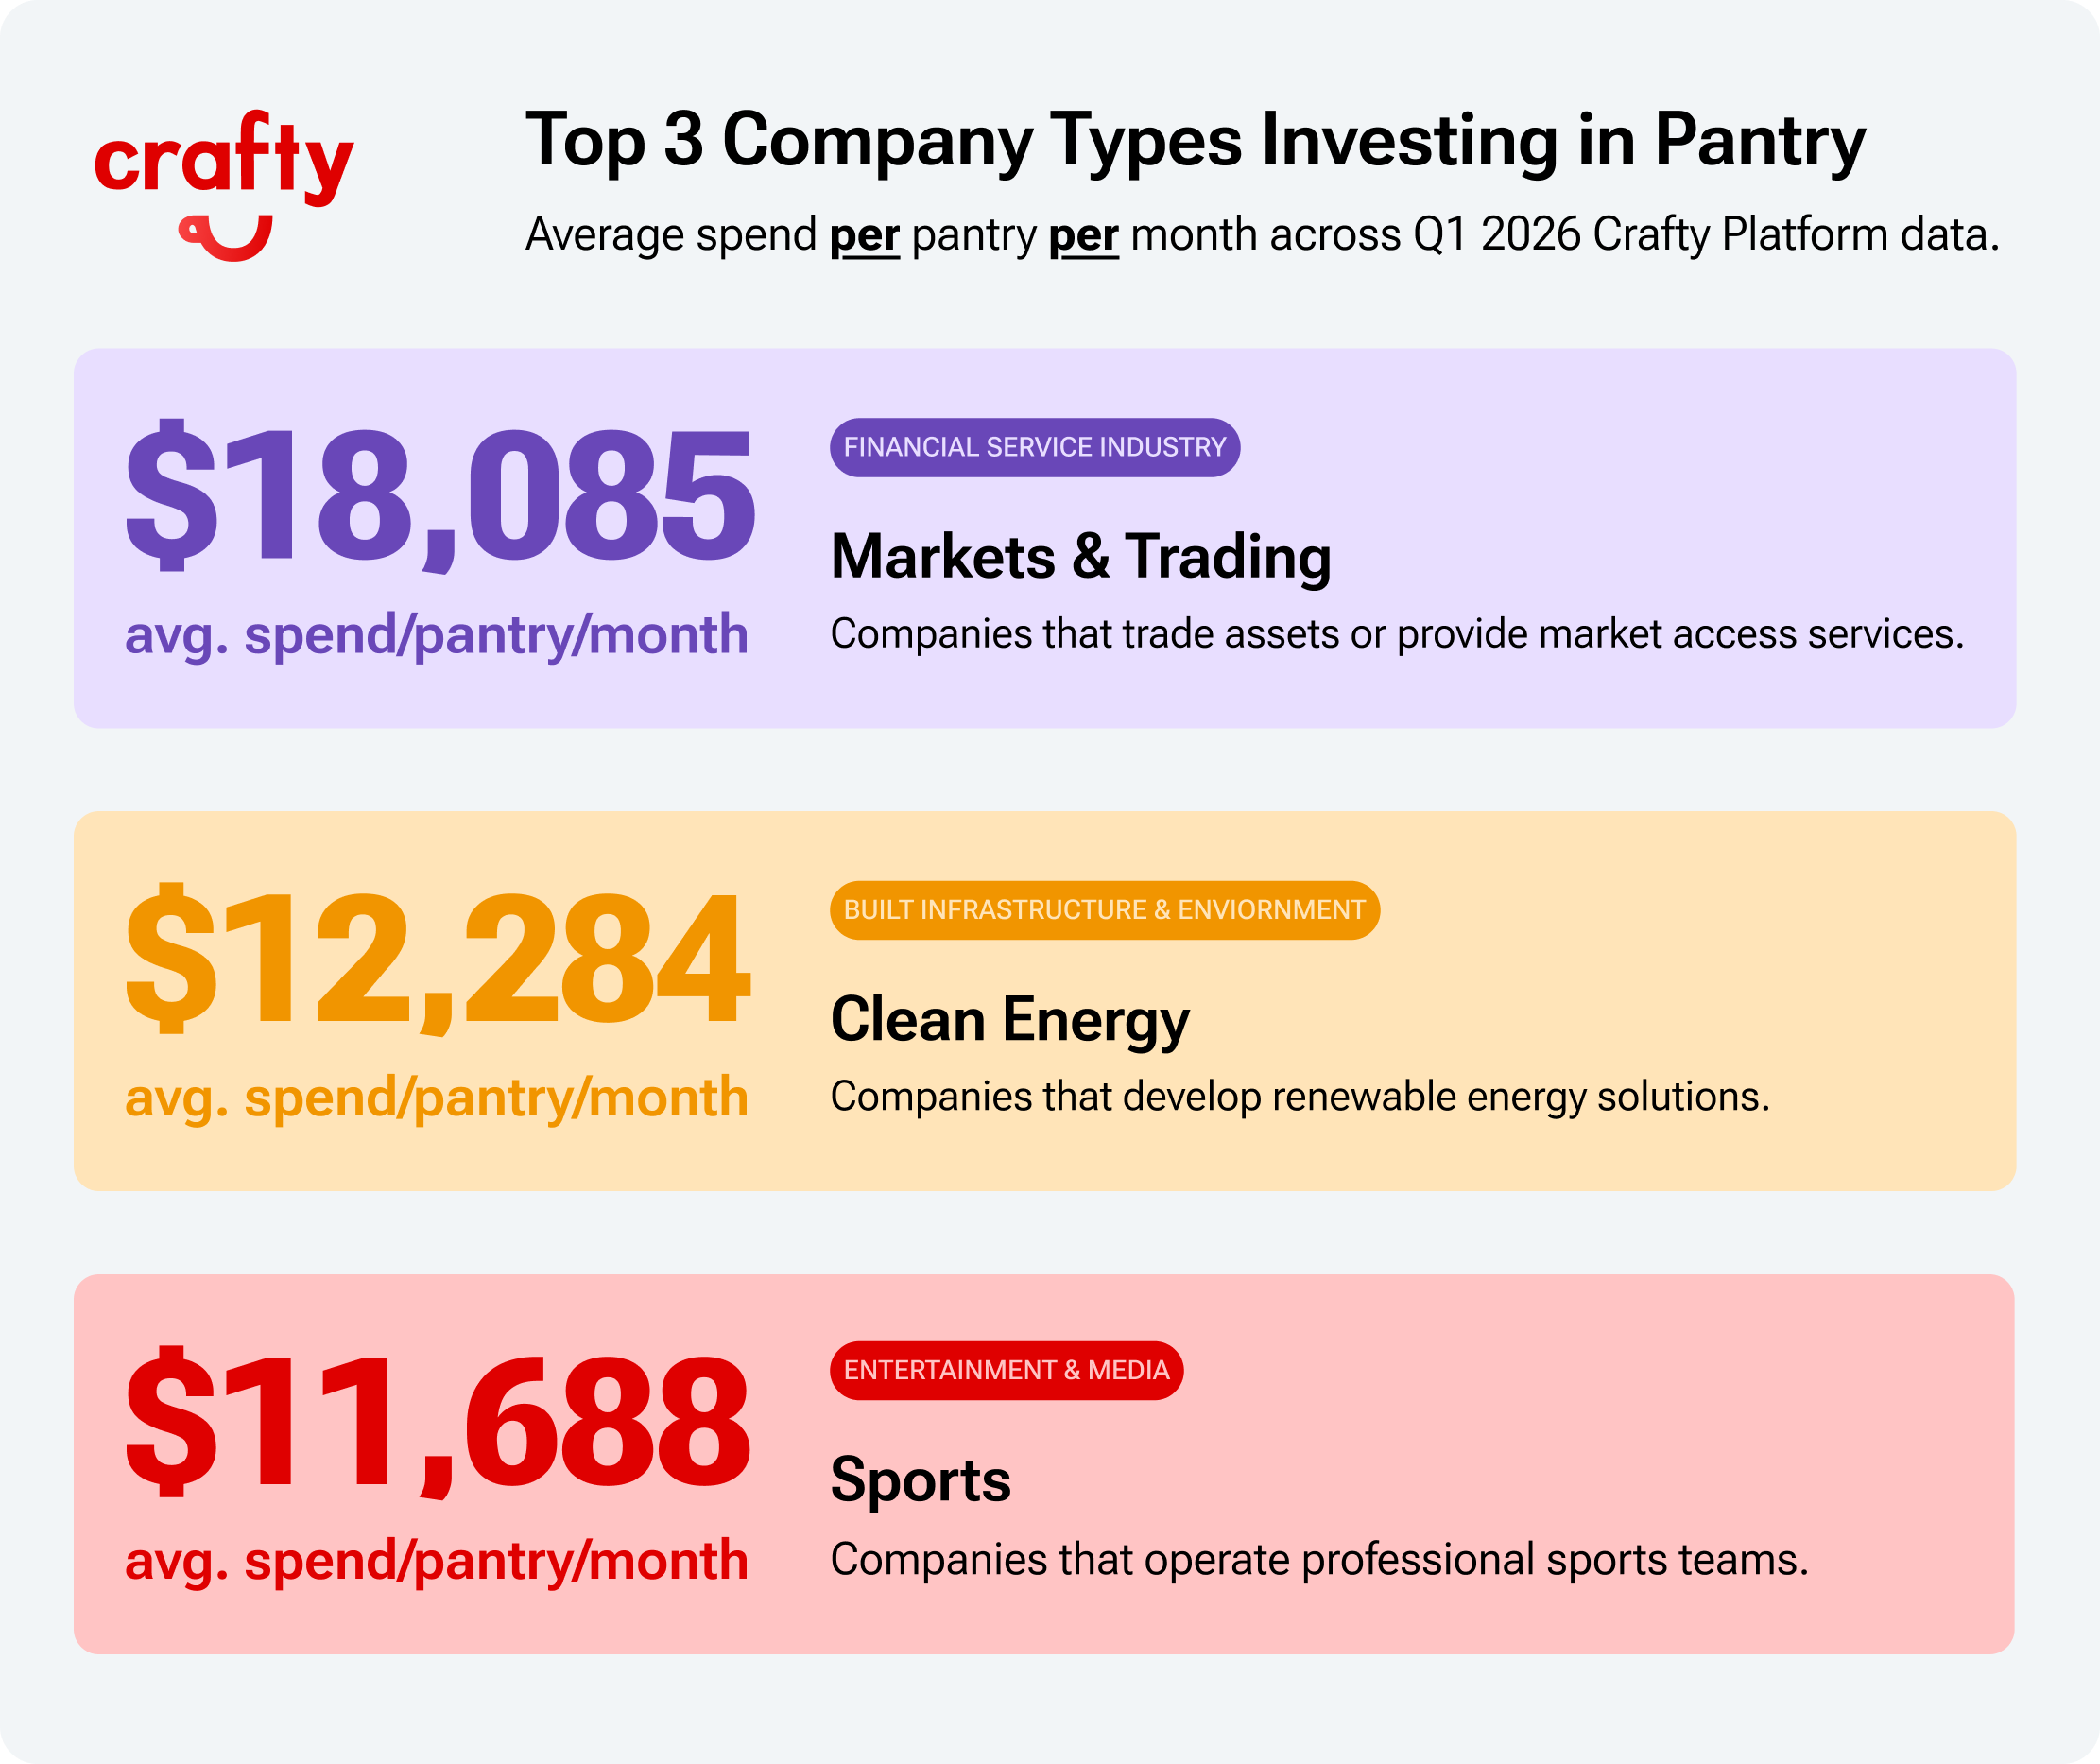
Avg. Office Pantry Spend by Company Type
- Financial Services:
- Banking & Advisory: $4,617/pantry/month
- FinTech: $9,125/pantry/month
- Insurance: $10,000/pantry/month
- Investment Firms: $9,247/pantry/month
- Markets & Trading: $18,085/pantry/month
- Technology:
- AI & Data: $9,146/pantry/month
- BioTech: $10,575/pantry/month
- Consumer Platforms: $8,374/pantry/month
- SaaS: $5,355/pantry/month
- Professional Services:
- Advisory & Consulting: $6,424/pantry/month
- Architecture & Engineering: $2,240/pantry/month
- Associations: $2,265/pantry/month
- Legal: $6,381/pantry/month
- Marketing Services: $3,169/pantry/month
- AdTech: $3,936/pantry/month
- Consumer Goods:
- Food & Beverage: $7,520/pantry/month
- Home & Lifestyle: $10,718/pantry/month
- Personal Care: $2,222/pantry/month
- Entertainment & Media:
- Gaming & Media Tech: $3,450/pantry/month
- Sports: $11,688/pantry/month
- Streaming & Content: $10,686/pantry/month
- Built Infrastructure & Environment:
- Clean Energy: $12,284/pantry/month
- Construction: $5,755/pantry/month
- Energy & Utilities: $4,159/pantry/month
- Real Estate: $1,821/pantry/month
- Logistics & Supply Chain:
- Logistics & Freight Services: $7,129/pantry/month
- Supply Chain Infrastructure: $6,688/pantry/month
As companies across industries race to adopt AI, they are competing for a smaller, more specialized pool of talent. Roles are becoming more technical, more demanding, and more output-driven. That pressure is showing up in how companies invest in the workplace. Pantry programs are being prioritized in the environments where performance demands are highest and where supporting talent day-to-day has the greatest impact.
Key Industry Takeaways:
- Professional services get lean: AI is actively reducing the need for labor-intensive work in professional services. Thomson Reuters reports that firms are using AI to automate research and analysis, enabling leaner teams and less consistent in-office demand, which directly impacts pantry investment.
- Financial services lead the pack: Investment is being driven by rapid AI adoption across trading, risk, and operations, increasing demand for technical talent. Deloitte reports that financial services firms are among the most aggressive in hiring for AI-related roles.
- Clean energy is scaling fast: Clean energy companies are expanding rapidly, driven by federal investment, infrastructure demand, and the push toward decarbonization. Entertainment & media is investing in output: Streaming and media companies are under pressure to produce more content at higher quality to compete for audience share. As platforms scale production and shorten release cycles, workplace programs like the pantry are being used to support long hours and high-output teams.
- Tech is more selective: Tech companies continue to invest, but with more discipline as efficiency becomes the priority. McKinsey reports that companies are increasingly using AI to drive productivity and reduce excess spend, shifting focus toward high-impact investments.
- Professional services get lean: AI is actively reducing the need for labor-intensive work in professional services. Thomson Reuters reports that firms are using AI to automate research and analysis, enabling leaner teams and less consistent in-office demand, which directly impacts pantry investment.
How It Breaks Down: Category Insights
If spend tells us how companies are thinking, product mix tells us how employees are behaving. Our Q1 data tells a story around what employees are prioritizing to align with their wellness goals, performance, and personal values.
Category Allocation (% of total pantry spend):
- Snacks: 30%
- Beverages: 29%
- Fresh & Frozen: 24%
- Coffee: 9%
- Tea: 6%
- Supplies: 3%
Top 10 Subcategories (% of total pantry products delivered):
- Sodas: 9%
- Milk: 9%
- Bars: 8%
- Still & Sparkling Water: 8%
- Chips & Crackers: 5%
- Produce: 5%
- Tea & Cocoa: 5%
- Dried Fruit & Nuts: 4%
- Sweets & Candy: 4%
- Yogurt & Cheese: 4%
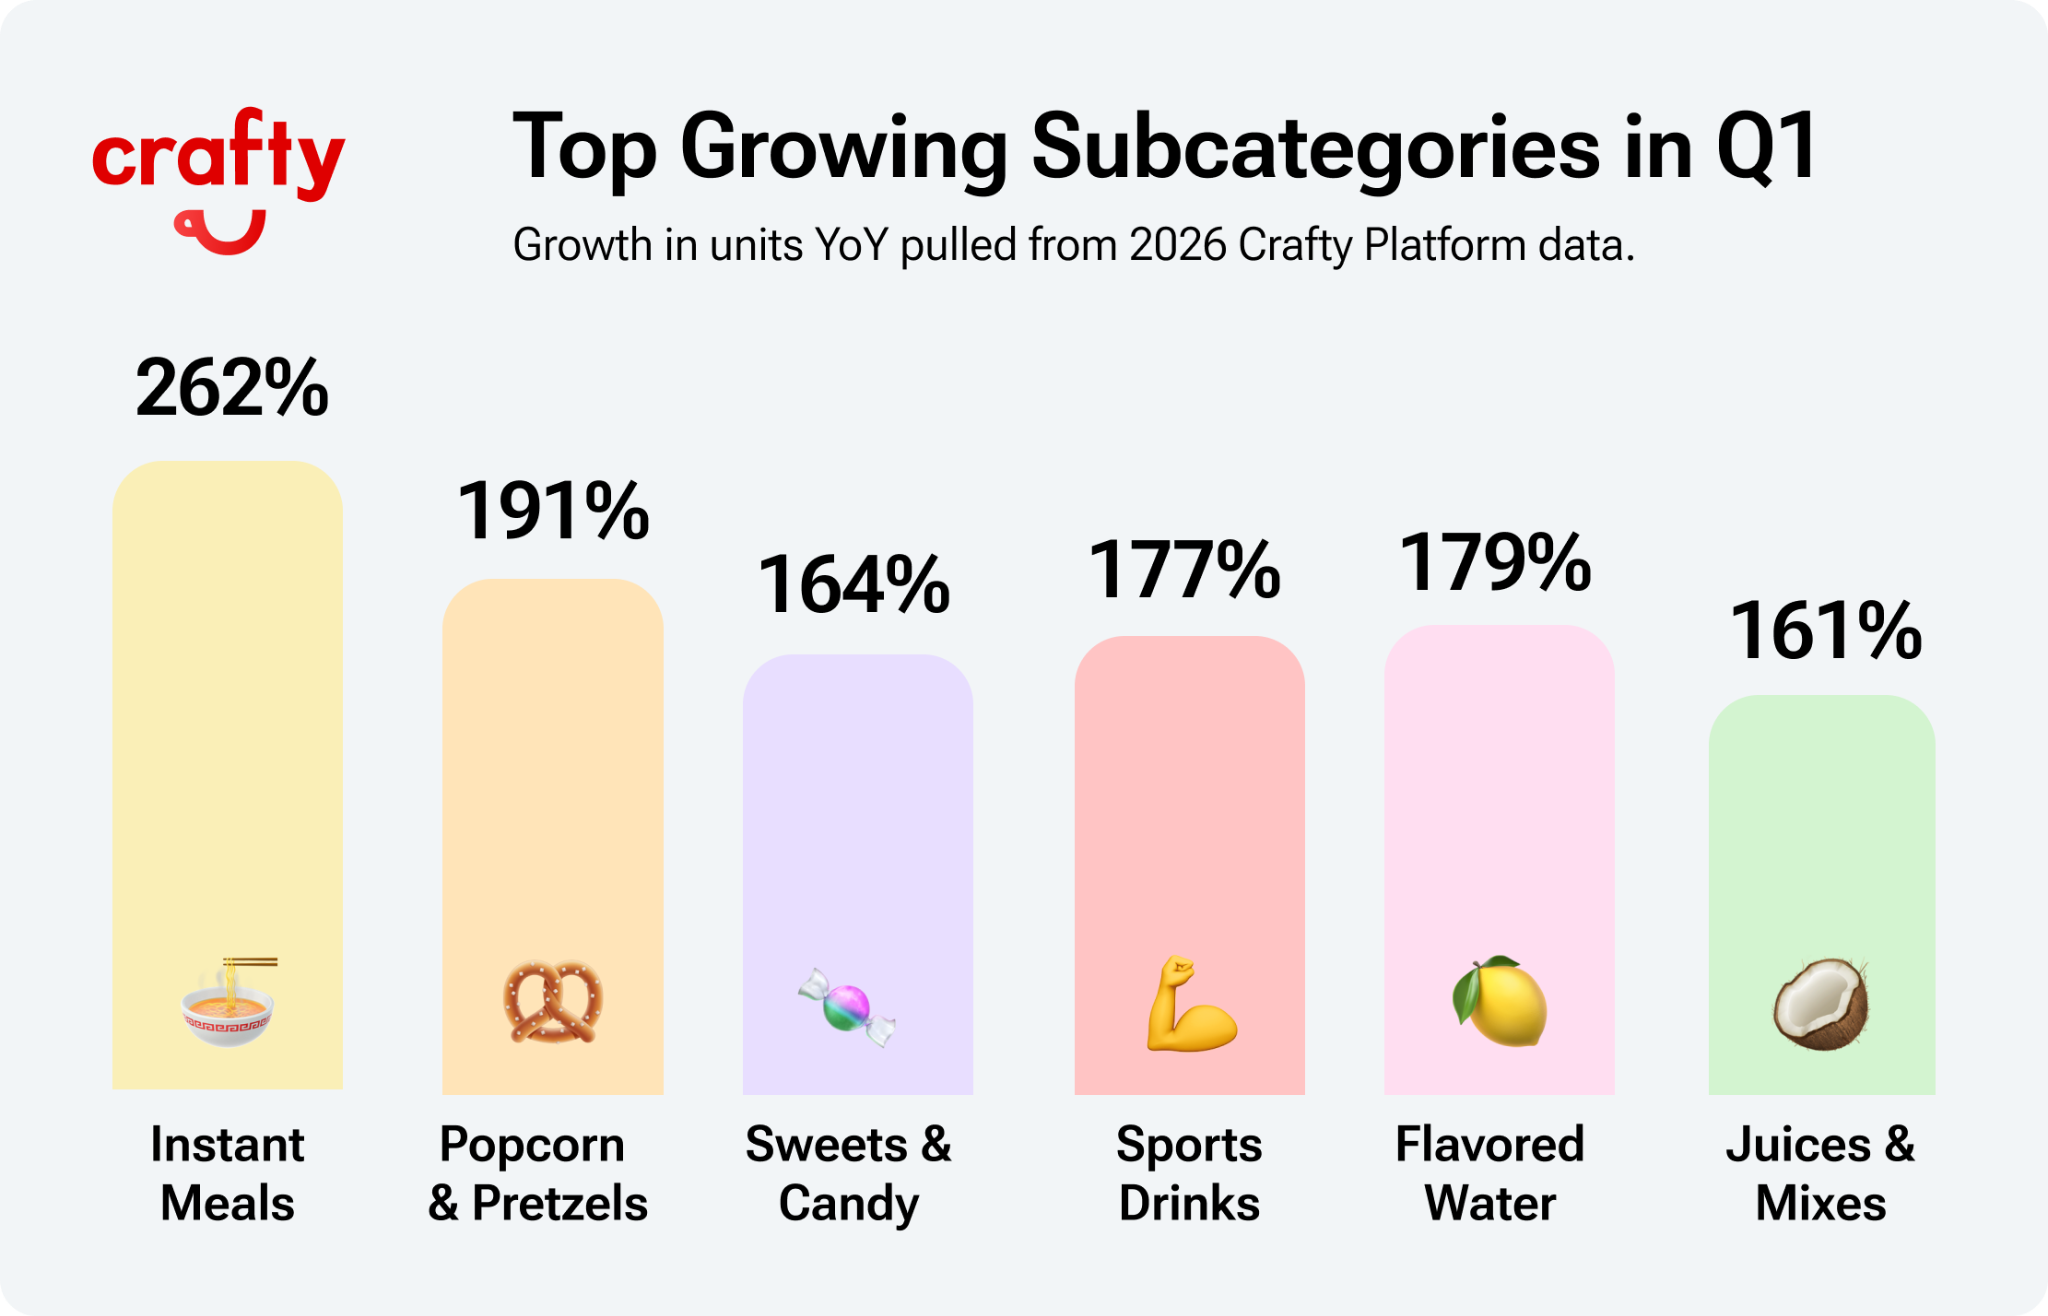
Top Growing Subcategories in Q1 (compared to last year):
- Instant Meals: +262%
- Popcorn & Pretzels: +191%
- Sweets & Candy: +164%
- Sports & Protein Drinks: +177%
- Flavored & Infused Water: +179%
- Juice & Mixers: +161%
- Yogurt: +151%
Top Growing Filters (compared to last year):
- High Protein: +134%
- B Corp: +125%
- Minority Owned: +133%
What's Trending: Key Pantry Product Insights
Based on our office pantry data, we’re seeing a clear shift toward function, control, and comfort, driven by broader changes in health, spending behavior, and daily routines.
- GLP-1 is changing how employees consume: People are eating less, but thinking more about what they eat. In Q1 2026 alone, the pharmaceutical company behind the leading GLP-1 medication Eli Lilly generated $12.9 billion in GLP-1 drug sales, driven by surging adoption of weight-loss treatments. Companies are creating more GLP-1-friendly office pantries that prioritize smaller, more functional food and beverage choices.
- Younger generations are eating their vitamins: For Gen Z and Millennials, wellness is showing up in what they eat, not what they take. There’s a clear shift away from traditional supplements toward foods and beverages that deliver benefits like protein, probiotics, and vitamins built right in. In fact, younger consumers are increasingly choosing functional foods over pills, prioritizing options that fit seamlessly into their daily routine.
- Comfort and nostalgia are still driving indulgence: Even with the focus on function, people are still reaching for familiar, comforting snacks. In fact, 51% of younger consumers say they actively seek nostalgic flavors, underscoring how strongly comfort influences food choices right now. That said, we're seeing a push for low-sugar office snacks and drinks that play off these flavors.
What’s Next: Evolving Your Pantry Strategy
As the workplace continues to evolve, companies are locking in to run their pantry with precision. Every decision, from how much you spend to what sits on the shelf, is being scrutinized and expected to perform. The most effective office pantry programs are no longer built on instinct alone. They are built on strategy, using data, built-in tools, and intuitive feedback loops to guide every move and ensure every dollar and every product choice delivers impact.
Related Resource

News
Crafty Launches Notification Center to Give Enterprise Workplace Teams Real-Time Operational Control
June 25, 2026
![The Insider's Guide to Choosing an Office Snack Service Provider [2026]](https://cdn.prod.website-files.com/68ef636bea7f569ab00567aa/6a342b8728e57bbb0e58bd25_Biotech%20Company%27s%20Snack%20Wall%20in%20San%20Francisco.jpg)
Blog
The Insider's Guide to Choosing an Office Snack Service Provider [2026]
June 18, 2026

Blog
Data Bites: The Top Employee-Voted Office Snacks
June 16, 2026

Blog
Data Bites: Fibermaxxing Inside the Workplace
June 9, 2026

Blog
Summer Office Pantry Ideas to Beat the Heat
June 1, 2026
Blog
July Holidays for Work: Snackable Celebrations to Refresh Your Breakroom
May 27, 2026

Blog
Data Bites: Top 3 Company Types Investing in Pantry Programs in Q1 2026
May 20, 2026

Blog
Intern Season is Upon Us. Is Your Corporate Pantry Ready?
May 19, 2026
![The Insider's Guide to Choosing a Workplace Pantry Provider [2026]](https://cdn.prod.website-files.com/68ef636bea7f569ab00567aa/6a064429bc506592521c423b_The%20Insider%27s%20Guide%20to%20Choosing%20a%20Workplace%20Pantry%20Provider%20%5B2026%5D.jpg)
Blog
The Insider's Guide to Choosing a Workplace Pantry Provider [2026]
May 14, 2026

Blog
How the Financial Services Industry Is Investing in Corporate Pantry Programs
May 14, 2026