min read
October 26, 2026
San Francisco Office Pantry Benchmarks 2026 (Data Through September)
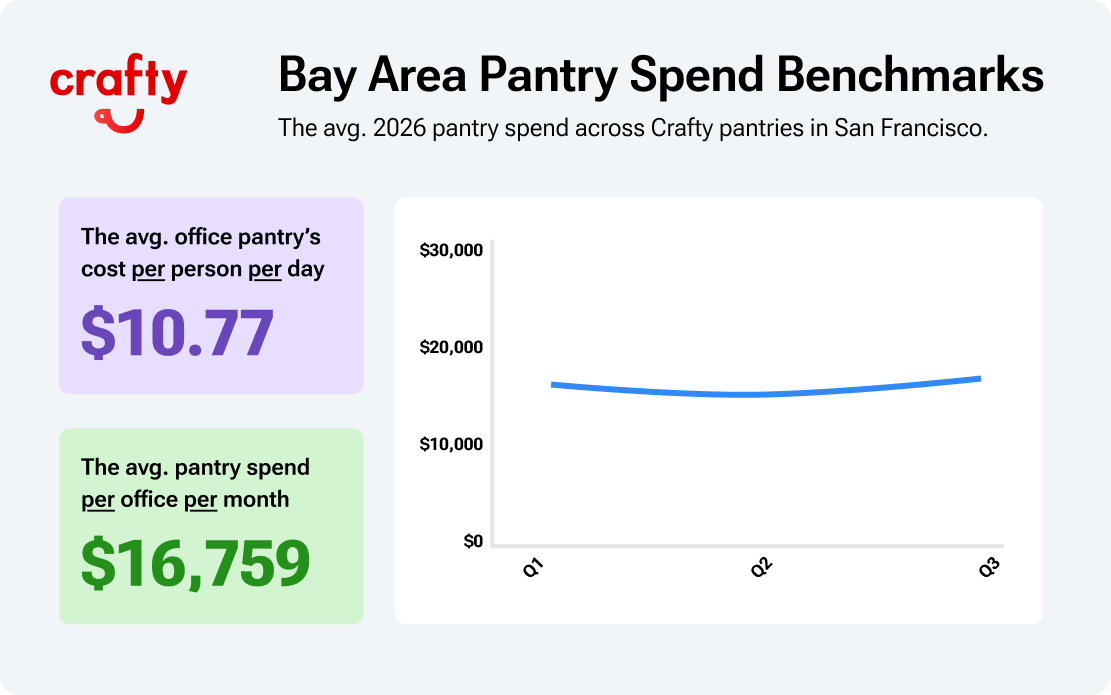
San Francisco Bay Area offices have spent $10.77 per person per day on pantry programs so far in 2026, peaking at $10.95 in Q3. Here’s how that investment breaks down by quarter, category, and product.

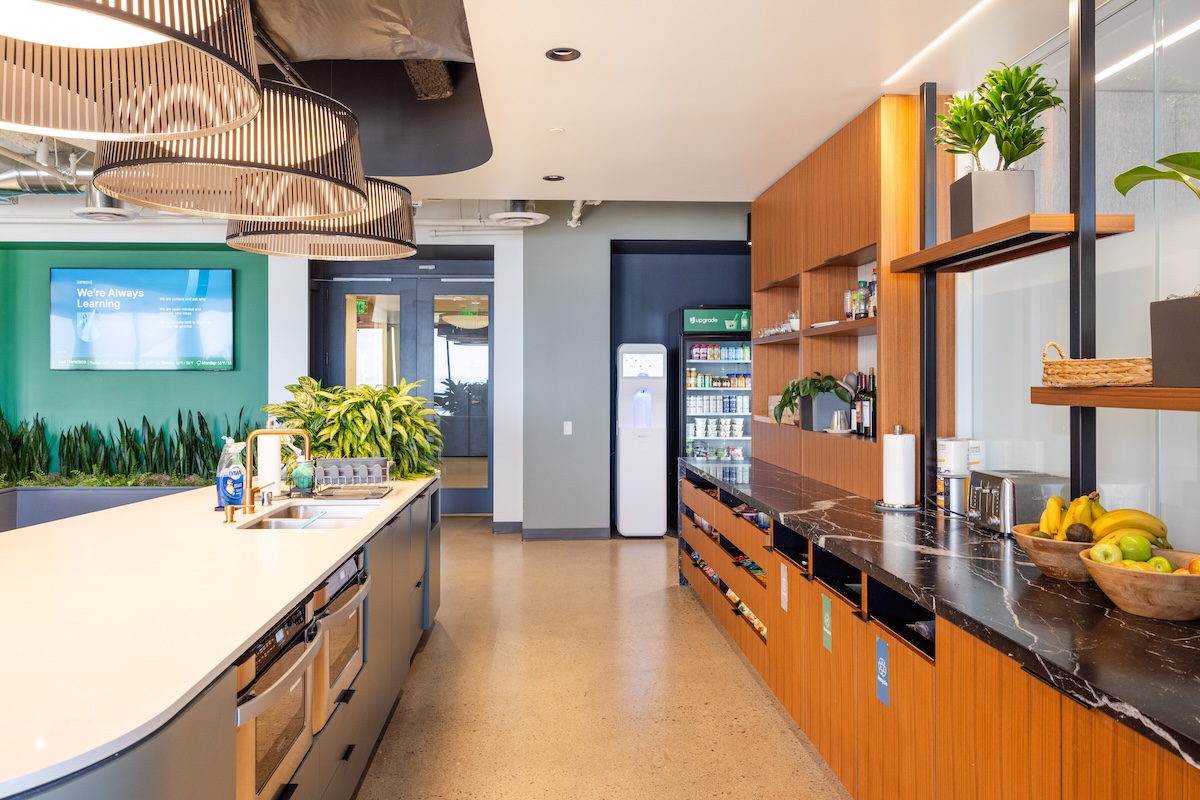
The San Francisco Bay Area is entering a new chapter, and AI is helping write it. As companies compete for talent and race to bring new technologies to market, they're investing in office space that brings their teams together. But getting employees into the office is only part of the equation. Employers also need to make that time worthwhile, and every workplace investment has to earn its place in the budget.
Some of the Bay Area's biggest AI companies are making that commitment clear. In March 2026, OpenAI subleased Dropbox's former 280,000-square-foot headquarters, then expanded into a five-building campus in Mountain View just weeks later. These investments signal growing demand for workplaces where teams can collaborate, move quickly, and build what's next.
That investment extends beyond office space to the everyday details that shape the workday, including the pantry. Using data from Crafty's Pantry Intelligence Index, we're looking at how much Bay Area offices spend on food and beverages, what that investment looks like per person per day, and which products employees reach for most. Updated quarterly, these benchmarks give workplace leaders a clearer picture of the local market and the data to make smarter budget decisions.
Key Takeaways
- AI expansion is fueling workplace investment: As AI companies lease more office space and bring teams together to build and launch new technologies, pantry budgets are growing alongside them. Monthly spend rose 1.5% from Q1 to Q3, reaching $17,096, reflecting continued investment in the everyday office experience.
- Growing attendance may be stretching pantry dollars further: More people in the office means more snacks, drinks, and coffee to stock, but not necessarily a bigger budget for each employee. While monthly spend increased 1.5%, cost per person per day rose just 0.9% to $10.95. That gap suggests more employees may be sharing the investment as offices fill up.
- Grab-and-go drinks are reshaping beverage budgets: When teams are moving between meetings, a cold drink from the fridge is often easier than stopping to brew coffee. Beverages gained share every quarter, reaching 38.6% in Q3, while Coffee's share declined. The shift suggests employees are turning to convenient, ready-to-drink options for their daily caffeine and hydration.
How Much Do San Francisco Offices Spend on Pantry Programs?
The race to lead in AI is putting San Francisco's offices back in the spotlight. Companies are competing for specialized talent, expanding their teams, and moving quickly to bring new technologies to market. That urgency is showing up in the city's office activity. San Francisco recorded the strongest growth in office visits among major markets in September, up 12.2% year over year, while companies were seeking a record 8.9 million square feet of office space by midyear.
San Francisco Office Pantry Spend Year to Date
- Average monthly pantry spend per office: $16,759
- Average cost per person per day: $10.77
All figures reflect 2026 year-to-date unless noted by quarter. See methodology.
In a market where talent and speed can determine who gets ahead, employers are investing in workplaces that help their teams perform. The Bay Area added more than 20,000 AI jobs over the past year, while 79% of San Francisco business leaders said they're bringing employees into the office more frequently.
With competition heating up, keeping teams fueled and focused throughout the workday becomes part of that investment. At $10.77 per person per day, San Francisco employers are investing in pantries that offer something for every part of the workday: cold brew for early starts, protein bars and yogurt for quick breaks, filling options when lunch gets pushed back, and refreshing beverages to keep teams going. Having that variety within reach helps employees stay focused on the work that matters.
Now, let's look at how San Francisco's pantry spending evolved throughout the year and what's driving those changes.
San Francisco Office Pantry Spend by Quarter
San Francisco entered 2026 with office vacancy at 34.4%, but the race for AI talent was already changing the market. Companies were signing leases, expanding their footprints, and making bigger commitments to bringing teams together. Office visits grew 10.9% year over year in the first half, putting San Francisco among the fastest-growing major markets.
That momentum wasn't immediate or consistent in the pantry. Monthly spend dipped in Q2 before climbing to a new high in Q3, finishing 1.5% above Q1. Meanwhile, product preferences shifted toward refreshing beverages, protein-rich options, and convenient snacks as employers adjusted their programs to changing workplace demand.
The pattern is worth watching. San Francisco's office market is expanding quickly, but pantry budgets and product preferences are evolving at their own pace. As more companies turn their real estate investments into occupied workplaces, the next question is how those changing workdays will shape what employees want from their pantries.
Bay Area Workplace Trends Driving Pantry Investment
AI expansion and competition for talent are reshaping San Francisco's office market. AI companies signed more than half of the city’s new office leases in Q2 2026, up from 45% in Q1. As companies compete for talent and premium space, they’re raising expectations for the workplace, including the food and drinks that keep teams fueled and performing.
- Office Attendance: San Francisco led major U.S. markets in September, with office visits up 12.2% year over year. As more employees spend time onsite, pantry demand grows, making accurate headcounts and flexible stocking essential to keeping favorites available without overspending.
- Hiring & Talent Competition: With unemployment at 3.7% and AI roles making up 57% of Bay Area tech job postings, competition for specialized talent is fierce. As companies compete for the same talent, the quality of the workplace becomes another way to differentiate themselves.
- Office Leasing & Flight to Quality: Class A buildings captured 55% of San Francisco leasing activity through mid-year. A premium address may attract attention, but amenities like a pantry tailored to employees' daily routines are what bring them back.
Let's take a closer look at the industries and company types driving San Francisco's growth and how their priorities are shaping workplace investment.
Which San Francisco Industries Invest Most in Office Pantries
San Francisco's AI boom is creating opportunities across industries, from the technology companies building new products to the financial firms funding their growth and the real estate and infrastructure companies supporting their expansion.
Top 3 San Francisco Industries Investing in Office Pantries
- Technology: AI companies leased more than 4.4 million square feet of San Francisco office space through Q3 2026. As companies expand beyond their startup roots, pantry programs need to scale with them. That means adjusting inventory to growing headcounts, maintaining popular products, and accommodating teams whose schedules may extend beyond traditional office hours.
- Financial Services: The Bay Area has attracted 80% of U.S. AI venture capital funding since 2020, putting financial firms at the center of the region's growth. From venture capital and investment banking to fintech, these teams operate in a high-pressure environment where time is valuable. Quality coffee, fresh food, and convenient meals help employees stay on schedule through client meetings, market activity, and investment decisions.
- Built Environment & Infrastructure: San Francisco's AI expansion is fueling demand for real estate, construction, and energy infrastructure, with office vacancy falling to 27.4% in Q3 2026. With employees moving between offices, job sites, and inspections, pantry priorities shift toward bulk hydration, coffee for early starts, and portable, high-protein snacks that support physically demanding workdays.
Top 3 San Francisco Company Types Investing in Office Pantries
- SaaS: Software companies are racing to develop and release new products, but 50% of developers lose at least 10 hours a week to organizational inefficiencies. Protecting focus time matters, even in the small details. A pantry stocked with Barebells Cookies & Cream, ITO EN Oi Ocha, and Philz Coffee Tesora gives employees easy access to protein, hydration, and caffeine without another interruption to their workflow.
- AI & Data: The Bay Area added more than 20,000 AI jobs over the past year, while some startups are adopting 80-hour workweeks to accelerate development. Extended schedules call for more substantial food options, including Smucker's Uncrustables, Nongshim Shin Ramyun, Wilcox Farms hard-boiled eggs, and fairlife Core Power.
- Consumer Platforms: Consumer technology companies depend on coordination across product, engineering, design, and marketing, yet 48% of workers describe their work as chaotic and fragmented. With schedules packed around launches, meetings, and product updates, grab-and-go options like Lesser Evil Organic Popcorn or Solely Fruit Jerky become especially practical.
From protecting focus time to supporting longer workdays, each industry has different priorities that influence what employees reach for. San Francisco's category spending reveals which products are gaining ground and where employers are directing their pantry budgets.
San Francisco Office Pantry Spend by Category
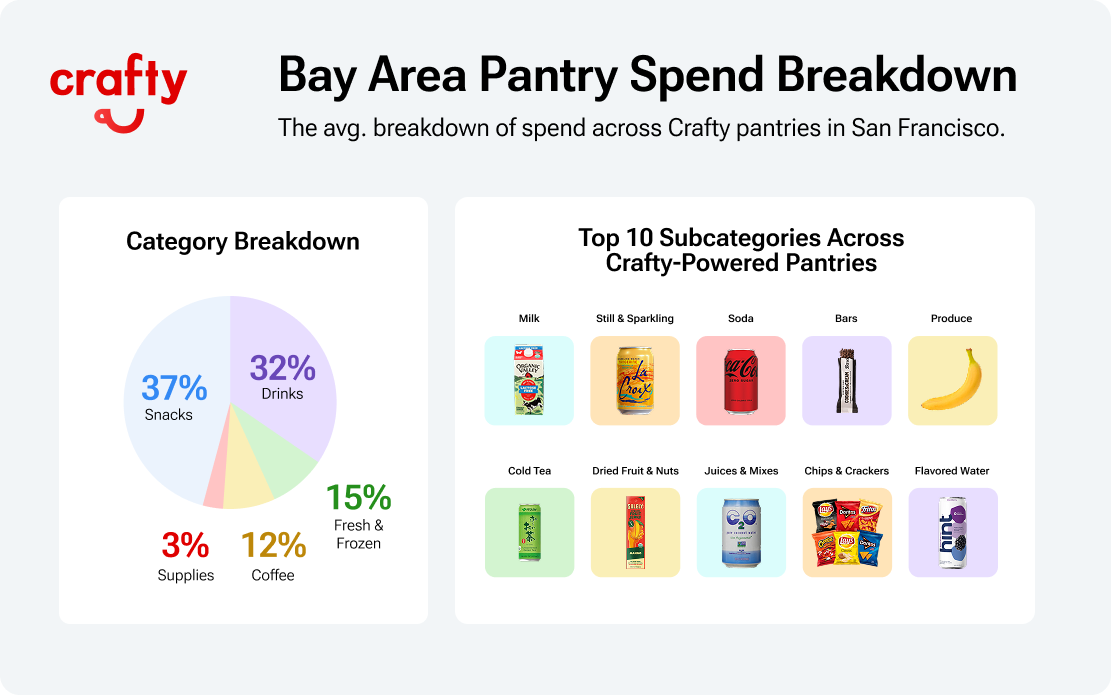
San Francisco employees are changing how they use the pantry. Ready-to-drink beverages are gaining share, shelf-stable snacks are edging out fresh food, and protein-rich options are climbing the rankings. Together, Beverages and Snacks account for nearly 70% of spending, revealing a growing preference for convenience without sacrificing variety.
How San Francisco Pantry Budgets Split by Category
- Beverages: 37%
- Snacks & Pantry: 32%
- Fresh & Frozen: 15%
- Coffee: 12%
- Supplies: 4%
Top 10 Office Pantry Subcategories in San Francisco
- Milk & Alternatives
- Still & Sparkling Water
- Sodas
- Bars
- Produce
- Cold Tea
- Dried Fruit, Nuts & Seeds
- Juices & Mixers
- Chips & Crackers
- Flavored & Infused Water
San Francisco Workplace Trends Driving Pantry Investment
- Beverages are taking a bigger share every quarter: Beverages grew from 36.4% of spend in Q1 to 38.6% in Q3, while coffee fell from 12.2% to 11.4%. Employees now have more drinks designed for specific needs, from coconut water and electrolyte mixes for hydration to energy drinks and cold teas for caffeine, or fairlife Core Power for protein. As functional benefits increasingly drive beverage purchases, coffee is becoming one of several ways employees fuel their day.
- Protein is expanding beyond bars and shakes: Yogurt entered the top 10 subcategories in Q3, joining established favorites like Barebells and fairlife Core Power. We’re also seeing protein-rich options emerge in other parts of the pantry, including hard-boiled eggs and Magic Spoon cereal. With 70% of Americans actively trying to consume more protein, employees have more ways to build filling snacks and quick meals from everyday pantry staples.
- The Bay Area is an early adopter of emerging products: San Francisco's rankings feature products like Meiji Hello Panda cookies, Magic Spoon, and Nongshim Shin Ramyun, reflecting an appetite for brands and formats beyond traditional office snacks. The Bay Area's reputation for early adoption may help explain why these products gain traction here before appearing among the best sellers in other markets.
The category shifts reveal changing habits, but the best sellers show which products employees consistently choose.
Best-Selling Office Pantry Products in San Francisco
San Francisco's best sellers reflect a market with an appetite for both innovation and familiar favorites. Bay Area snack, drink, and coffee brands like Philz Coffee, Clover Sonoma, Numi Organic Tea, Hint, and Donsuemor have earned spots alongside national staples like Coke Zero and Barebells. From functional drinks and protein-rich snacks to premium coffee and sweet treats, the rankings show employees value variety without giving up the products they know and love.
San Francisco Pantry Subcategory Rankings and Best Sellers (2026 to Date)
- Milk & Alternatives: Organic Valley Organic Milk
- Still & Sparkling Water: LaCroix Tangerine
- Sodas: Coke Zero
- Bars: Barebells Cookies & Cream
- Produce: Bananas
- Cold Tea: ITO EN Oi Ocha Unsweetened Green Tea
- Dried Fruit, Nuts & Seeds: Solely Fruit Jerky
- Juices & Mixers: C2O Pure Coconut Water
- Chips & Crackers: Frito-Lay Classic Mix Variety Pack
- Flavored & Infused Water: Hint Blackberry
- Yogurt: Chobani Non-Fat Plain Greek Yogurt
- Sweeteners & Creamers: Clover Sonoma Organic
- Deli & Prepared Foods: Wilcox Farms Organic Hard-Boiled Eggs
- Sweets & Candy: Donsuemor Traditional Madeleines
- Sports & Protein Drinks: fairlife Core Power Protein Shake
- Breakfast: Magic Spoon Cereal Treats
- Energy Drinks: CELSIUS Tropical Vibe
- Popcorn & Pretzels: Lesser Evil Organic Popcorn
- Breads: Dave’s Killer Bread
- Cookies: Meiji Hello Panda
- Cold Brew & Iced Coffee: La Colombe Cold Brew
- Coffee & Coffee Beans: Philz Coffee Tesora
- Jerky: Think Jerky Original Beef
- Pods & Capsules: Nespresso Espresso Forte
- Kitchen & Disposables: EcoChoice
- Condiments: Justin’s Classic Peanut Butter
- Hot Tea: Numi Organic Tea Moroccan Mint
- Spreads: Wholly Guacamole Classic
- Frozen: Smucker’s Uncrustables
- Kombucha: GT’s Synergy Kombucha
- BiBs & Fountain: Bevi Electrolytes
- Instant Meals: Nongshim Shin Ramyun
- Cleaning Products: Nespresso Recycling Bag
- CO2 & Nitrogen: 5 lb CO2 Tank
- Personal Care: Emergen-C Variety Pack
The takeaway is in the balance. Employees are embracing newer products and functional options, but established favorites still anchor the pantry. For workplace leaders, the opportunity is to use those reliable sellers as a foundation while making room for the products gaining traction locally.
Next, we'll turn those insights into practical ways to improve your San Francisco pantry program.
How to Use San Francisco Benchmarks to Improve Your Office Pantry
Here's how to turn San Francisco's latest pantry trends into smarter stocking decisions.
- Give employees more ways to hydrate and caffeinate: With beverages reaching 38.6% of spending in Q3, coffee is no longer the only way employees fuel their day. Offer a mix of cold teas like ITO EN, energy drinks like CELSIUS, and functional hydration through coconut water or Bevi Electrolytes.
- Choose functional snacks with a nostalgic twist: Bay Area employees are embracing products that deliver familiar flavors with added nutritional value. Think Magic Spoon for a protein-forward take on childhood cereal, Barebells for a candy-bar-inspired protein snack, and Solely Fruit Jerky for a fruit-forward alternative to traditional sweets. Look for products that offer protein, fiber, or other nutritional benefits while still delivering on taste.
- Make room for California brands: Local favorites like Philz Coffee, Clover Sonoma, Hint, and Donsuemor have earned their place among San Francisco's best sellers. Use that demand to bring more California-made products into your assortment, balancing regional favorites with national staples. It's a way to make the pantry feel connected to the Bay Area while still delivering consistency in pantry offerings across your offices.
San Francisco Office Pantry FAQs
How much do San Francisco offices spend on pantry programs?
San Francisco Bay Area offices have spent an average of $16,759 per month on pantry programs so far in 2026, or $10.77 per person per day. Monthly spend dipped from $16,838 in Q1 to $16,321 in Q2, then climbed to $17,096 in Q3.
What is the average cost per person per day for an office pantry in San Francisco?
The average cost per person per day was $10.77 across the first three quarters of 2026. It reached $10.85 in Q1, dropped to $10.50 in Q2, and climbed to $10.95 in Q3. This metric helps you understand how much you're investing in each employee, regardless of office size or attendance.
What are the most popular office snacks in San Francisco?
San Francisco’s top five best sellers so far in 2026 are Organic Valley Organic Milk, LaCroix Tangerine, Coke Zero, Barebells Cookies & Cream, and Bananas. Local brands lead their subcategories too, including Philz Coffee, Clover Sonoma, Numi Organic Tea, and Hint.
How can I benchmark my office pantry in San Francisco?
Start with your cost per person per day and compare it with San Francisco’s 2026 year-to-date average of $10.77. Then look at how your industry and company type use the pantry to see where your program is ahead or behind. Our benchmarking guide walks through each step.
What San Francisco’s Pantry Data Means for Your Workplace
San Francisco's office market is gaining momentum, and the pantry data reveals how employers are responding. Office drink variety is expanding, protein is finding its way into more categories, and local brands are holding their own against national favorites. These shifts offer a clearer picture of what employees value and where workplace leaders should focus their investments.
The opportunity is to use those insights to make smarter decisions about what to stock, what to test, and where to spend. Explore the Pantry Intelligence Index to compare your office against San Francisco peers and build a stronger case for your next budget decision. We'll update these benchmarks every quarter as the market evolves.
Methodology Behind Crafty's Bay Area Pantry Benchmarks
This analysis draws on Crafty-powered pantries across the San Francisco Bay Area from January through September 2026. Figures reflect 2026 year-to-date, and the quarterly breakdown looks at each quarter on its own, so quarterly best sellers may differ from the year-to-date rankings. Spend figures are network averages in USD, and subcategories and best sellers are ranked by units delivered. Explore the full San Francisco Bay Area data in the Pantry Intelligence Index.
Related Resource

Blog
What Texas Offices Want in the Pantry, From Dallas to Austin and Houston
October 26, 2026
Blog
San Francisco Office Pantry Benchmarks 2026 (Data Through September)
October 26, 2026

Blog
Your Office Guide to the Types of Protein in Snacks
October 23, 2026

Blog
Equipment Guide: The Best Office Coffee Machines for Your Team
October 22, 2026

Blog
Best Low Carb Snacks for the Office Pantry
October 21, 2026
Blog
Office Pantry Services in Texas: How Crafty Is Growing Across Dallas, Austin & Houston
October 15, 2026

Blog
What Makes Fruit “Office-Ready”? From Farm Selection to Delivery Standards
October 15, 2026
Blog
The Procurement Guide to Evaluating Office Pantry Providers
October 14, 2026

Blog
Equipment Guide: Sparkling Water Machines for the Office
October 14, 2026