min read
October 27, 2026
Chicago Office Pantry Benchmarks in 2026 (Data Through September)
Chicago offices have invested $11.56 per person per day in pantry programs so far in 2026. Here’s how that investment breaks down by quarter, industry, and product.

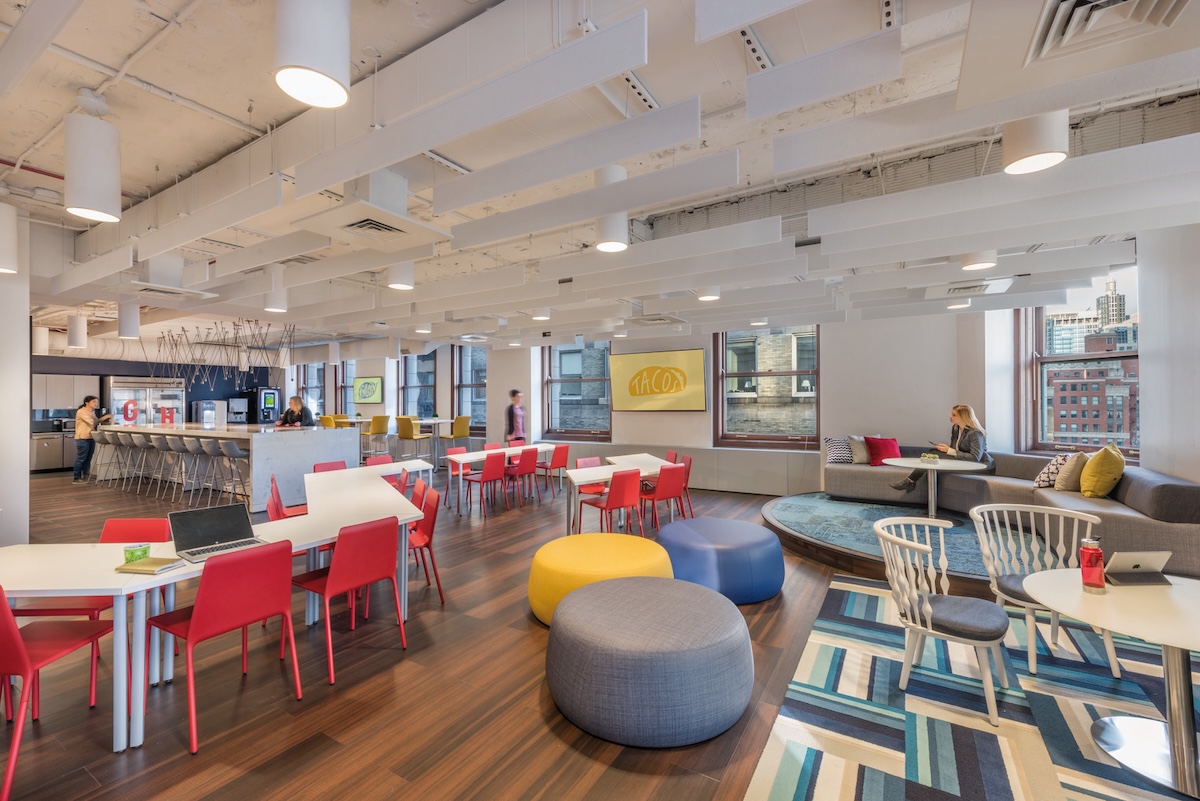
Chicago's workplace landscape is changing. Companies are rethinking where their teams work, how they use their offices, and what it takes to make the commute worthwhile. With employees expecting more from their time onsite and budgets under scrutiny, workplace leaders have to be more intentional about where they invest.
And some of Chicago's biggest employers are making major moves. Google plans to relocate more than 2,500 employees from Fulton Market to the Thompson Center in the Loop. It's a significant commitment to the city's office market and another sign that companies are investing in their physical workplaces.
So what does that investment look like when it comes to the everyday employee experience? Powered by the Crafty Pantry Intelligence Index, this page breaks down how much Chicago offices spend on their pantry programs, what they're investing per person per day, and which products employees reach for most. Updated quarterly, these benchmarks help workplace leaders understand the local market, compare their programs, and make smarter decisions about where to invest.
Key Takeaways
- Chicago pantry spend grew 5.3% from Q1 to Q3, reaching $20,253 per office per month: The increase came as office attendance hit its highest level since 2020, suggesting more employees returning to the workplace are driving demand.
- Cost per person per day held between $11.24 and $11.81, even as total spending rose: More employees appear to be sharing the investment, showing how growing attendance can push up budgets while companies keep per-employee spend consistent
- Coffee accounts for 16.7% of spend, and Milk & Alternatives gained ground: Coffee remains a major part of Chicago’s office culture. Growing interest in protein-forward products points to demand for more filling options throughout the workday.
How Much Do Chicago Offices Spend on Pantry Programs?
Chicago offices are getting busier, and employers are investing in better spaces. In June 2026, the city reached its highest office attendance since 2020. Downtown, companies are making major commitments to the workplace, including Morningstar's 75,000-square-foot lease at the Thompson Center alongside Google. As more employees return to upgraded offices, the experience inside those spaces matters just as much.
Chicago Office Pantry Spend Year to Date
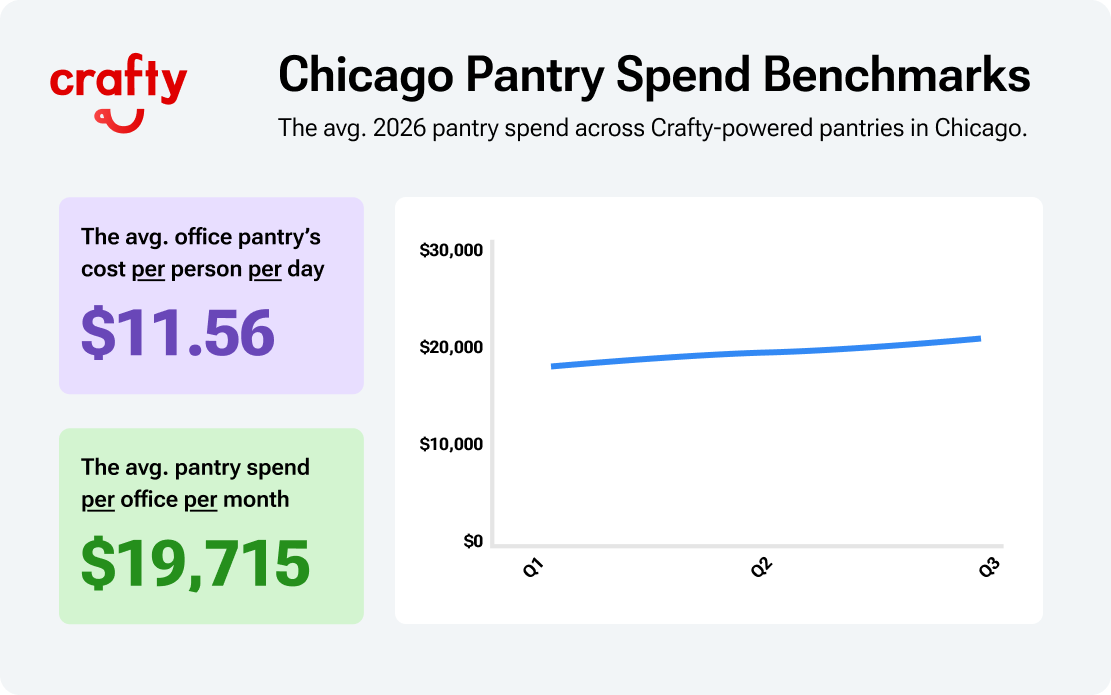
- Average monthly pantry spend per office: $19,715
- Average cost per person per day: $11.56
All figures reflect 2026 year-to-date unless noted by quarter. See methodology at the bottom.
Chicago runs on a midweek rhythm. Attendance peaks in the middle of the week and Fridays stay quiet, so pantries have to handle crowded anchor days without overstocking for the end of the week.
This is why cost per person per day the number to watch for the experience your pantry delivers as attendance fluctuates. Cost per person per day measures the average pantry investment per employee for each day the office is open.
The year-to-date numbers set the baseline. The quarterly view shows how Chicago got there.
Chicago Office Pantry Spend by Quarter
Chicago entered 2026 with downtown office vacancy at a record 28.6%. Employers were working to bring people back, but requiring attendance may get employees through the door; making the office somewhere they actually want to spend time is what moves the needle.
Chicago employers saw that and started putting more behind the experience. Pantry spend climbed every quarter, growing 5.3% from Q1 to Q3. And office attendance started rebounding, too. Office visits grew 6.9% year over year in the first half of 2026, reaching their highest post-pandemic level by June. As Chicago offices fill up, employers are investing more in the everyday experience.
The quarterly numbers show how Chicago's pantry priorities evolved throughout the year. But what's driving those changes? A closer look at the city's workplace market helps explain where investment is headed next.
Chicago Workplace Trends Driving Pantry Investment
Chicago's office market is gaining momentum, but the expectations for what happens inside those offices are changing, too. More employees are returning, competition for specialized talent is growing, and companies are moving into higher-quality spaces. Together, these trends are pushing employers to rethink what makes an office worth coming into.
- Office Attendance: Chicago's office visits grew faster than the national average in August 2026. Nationally, 55% of Fortune 100 companies now require five days onsite. As offices get busier, employers need to deliver an experience that makes those days worthwhile, from reliable coffee to food and snacks that keep teams going.
- Hiring & Talent Competition: Chicago's unemployment rate reached 5.6% in August, but demand for specialized talent tells a different story. AI-related job postings surpassed their full-year 2025 total in just the first six months of 2026. As banks, consulting firms, and tech companies compete for the same skills, the workplace experience becomes another way to attract and retain talent.
- Office Leasing & Flight to Quality: Trophy and Class A buildings accounted for 53% of downtown leasing in Q2 2026. Trophy properties also gained 365,000 square feet of occupied space as other buildings lost tenants. Employers are investing in better offices, raising expectations for the amenities inside them. A premium building needs a workplace experience to match.
These trends are shaping how Chicago's biggest industries invest in the workplace and their pantry programs.
Which Chicago Industries Invest Most in Office Pantries
Chicago is home to one of the country’s deepest corporate bases. The metro has 30 Fortune 500 headquarters, second only to New York. In Chicago’s pantry data, a few industries and company types stand out. They share a common thread: high-stakes, focus-heavy work where the office has to support performance as much as connection.
Top 3 Chicago Industries Investing in Office Pantries
- Technology: Chicago’s tech footprint is growing with AI. AI firms occupied about 308,000 square feet of Chicago office space by mid-2026. As tech teams expand into new space, the pantry becomes part of how companies build culture and compete for engineers.
- Financial Services: Chicago’s financial firms are still doubling down on downtown. Huntington Bank is expanding its Loop workspace and adding a decade to its lease. Long-term commitments like that signal that finance sees the office as a long-term investment, and the experience inside it has to deliver every day.
- Professional Services: Chicago’s law and advisory firms are growing their footprints. Chicago saw 38 law firm expansions in Q1 2026, led by firms like Mayer Brown. These teams host clients and run long meetings, so a well-stocked pantry fuels the team and signals hospitality to every visitor.
Top 3 Chicago Company Types Investing in Office Pantries
- SaaS: SaaS teams do their best work in long, uninterrupted stretches. In GitHub’s research, developers had an 82% chance of a good day when they faced few or no interruptions, and context switches proved costly to recover from. Even deciding where to grab a cold brew or a protein bar is a context switch. Keeping cold brew, sparkling water, and protein bars like Barebells within reach removes that decision, so employees stay in the flow.
- Investment Firms: Investment teams spend long days in diligence, models, and portfolio reviews. Private equity associates average 58 hours a week. That’s nearly 12 hours a day across a five-day week, and on days that long, leaving for a real meal often isn’t an option. Filling, protein-forward options like Frigo Cheese Heads, Chobani Greek Yogurt, and Think Jerky turn quick snacks into real fuel from the morning meeting to the late-night model.
- Markets & Trading: Trading teams make high-stakes calls on market hours, with no time to step away from the desk. One study found that hungry participants took on more risk in financial gambles. When stepping away means missing a move, hunger becomes a performance risk. Coffee ready before the opening bell and grab-and-go snacks within arm’s reach let traders refuel without leaving their screens.
Each industry brings different needs to the pantry. Chicago's category data shows where those priorities translate into spending.
Chicago Office Pantry Spend by Category
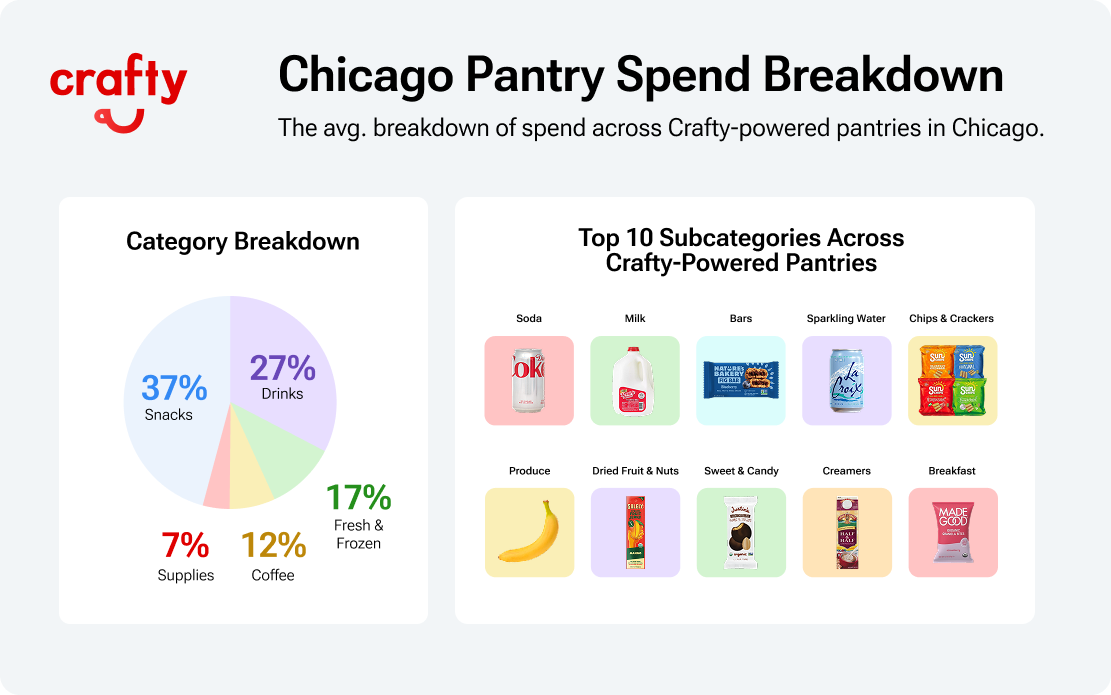
Chicago pantries are built for full days in the office. Snacks & Pantry and Beverages together make up nearly two-thirds of spend, and the mix is shifting toward products that do more: protein that keeps employees full, drinks that deliver energy, and coffee that replaces the café run. As the office day gets longer, the pantry is doing more of the work that lunch breaks and coffee shops used to do.
How Chicago Pantry Budgets Split by Category
- Snacks & Pantry: 37%
- Beverages: 27%
- Coffee: 17%
- Fresh & Frozen: 12%
- Supplies: 7.0%
Top 10 Office Pantry Subcategories in Chicago
- Sodas
- Milk & Alternatives
- Bars
- Still & Sparkling Water
- Chips & Crackers
- Produce
- Dried Fruit, Nuts & Seeds
- Sweets & Candy
- Sweeteners & Creamers
- Breakfast
Chicago Office Pantry Trends to Watch
- Beverages are becoming more functional: Beverages grew from 26.3% of Chicago pantry spend in Q1 to 26.8% in Q3. Diet Coke and LaCroix remain staples, but Aspire energy drinks, Hint flavored water, and ITO EN green tea show the range of options employees are choosing. That reflects a broader shift of consumers increasingly choosing drinks for specific outcomes like energy, hydration, and focus.
- Convenience is overtaking fresh: Produce ranked among Chicago's top five subcategories in Q1 before Chips & Crackers took its place in Q2 and Q3. That mirrors research that found convenience surpassed healthfulness as a food purchase driver for the first time in 21 years. With Chicago's busiest office days concentrated midweek, employees are gravitating toward options they can grab quickly between meetings.
- Snacks are becoming smaller meals: Bars rank #3 in Chicago, with protein-forward Barebells taking the lead in Q3. Think Jerky, Chobani Greek Yogurt, and Frigo Cheese Heads also top their subcategories. Nationally, 62% of Americans reported replacing traditional meals with snacks or smaller meals, and Chicago's protein-heavy favorites reflect that shift toward more filling options that can do the work of a meal during busy office days.
- Familiar favorites are holding their ground: Sodas, water, and Chips & Crackers consistently rank among Chicago's top subcategories, led by Diet Coke, LaCroix Pure, and SunChips. Even as functional drinks and protein snacks gain attention, familiar products remain central to the pantry. That tracks with findings that show taste remains the biggest food purchase driver. Employees may be eating for more specific outcomes, but they still want products they know and enjoy.
Now let's look at the products Chicago employees are reaching for most and what those favorites reveal about their preferences.
Best-Selling Office Pantry Products in Chicago
Chicago’s pantry rankings have a distinctly local flavor. While national brands dominate many categories, local favorites are competing right alongside them. Big Shoulders tops Cold Brew, Aspire leads Energy Drinks, and Chicago-born Think Jerky and SkinnyPop lead their respective subcategories.
Chicago Pantry Subcategory Rankings and Best Sellers (2026 to Date)
- Sodas: Diet Coke
- Milk & Alternatives: Prairie Farms Whole Milk
- Bars: Nature’s Bakery Whole Wheat Fig Bar
- Still & Sparkling Water: LaCroix Pure
- Chips & Crackers: SunChips Variety Pack
- Produce: Bananas
- Dried Fruit, Nuts & Seeds: Solely Fruit Jerky Mango
- Sweets & Candy: Justin’s Dark Chocolate Peanut Butter Cups
- Sweeteners & Creamers: Land O’Lakes Half & Half
- Breakfast: MadeGood Foods Granola Minis
- Sports & Protein Drinks: Gatorade Zero Thirst Quencher
- Coffee: Counter Culture Hologram
- Deli & Prepared: Frigo Cheese Heads Original
- Kitchen & Dining: Eco-Products 7 3/4" Jumbo Straws
- Energy Drinks: Aspire Strawberry Watermelon
- Cold Tea: ITO EN Oi Ocha Unsweetened Green Tea
- Yogurt: Chobani 0% Greek Yogurt
- Jerky: Think Jerky Original Turkey Jerky
- Hot Tea: Rishi Tea Barista Everyday
- Flavored & Infused Water: Hint Watermelon
- Pods & Capsules: Nespresso Caffè Caramello
- Cold Brew & Iced Coffee: Big Shoulders Nitro Original Cold Brew
- Juices & Mixers: C2O Pure Coconut Water
- Cookies: Meiji Hello Panda Cookies
- Popcorn & Pretzels: SkinnyPop Original
- Frozen: MadeWith Foods Organic
- Breads: Dave’s Killer Bread Plain Awesome
- Spreads: Kirkland Signature Organic Peanut Butter
- BiBs & Fountain: Coke Zero
- Condiments: Jif To Go Creamy Peanut Butter
- Cleaning Products: WipesPlus No-Rinse Food Surface Wipes
- Instant Meals: Mamma Chia Strawberry Banana
- CO2 & Nitrogen: 5-Pound Nitrogen Tank
- Kombucha: GT’s Synergy Kombucha
- Personal Care: Kleenex Ultra Soft Facial Tissues
- Event Essentials: Modelo Especial Tap Handle
That mix reflects Chicago’s strong food and beverage industry, where homegrown innovators have built loyal followings. Their presence in office pantries shows how local preferences carry into the workplace, even as companies stock nationally recognized products. For more ideas, explore our guide to Chicago brands for the office.
Benchmarks are most useful when they shape decisions. Here’s how to put Chicago’s data to work.
How to Use Chicago Benchmarks to Improve Your Office Pantry
Chicago's benchmarks reveal where employees are spending their time, what they're reaching for, and how pantry preferences are changing. Here are three ways to turn those insights into a better experience without stretching your budget.
- Turn everyday snacks into more filling options: With protein and convenience shaping Chicago's pantry choices, look for ways to make existing products work harder. Combine Chobani Greek Yogurt, bananas, and granola for a quick breakfast, or pair cheese and crackers for an afternoon snack. Explore more high-protein and high-fiber combinations that give employees more substantial options without adding dozens of new products.
- Make coffee an everyday perk with seasonal appeal: Coffee accounts for 16.7% of Chicago pantry spend, making it a major part of the daily experience. Start with great hot coffee, cold brew, and milk options, then bring in seasonal syrups and toppings to create café-style drinks without the café price tag. A few simple additions can turn the coffee station into a seasonal moment without a big event or budget. And on busy midweek mornings, reliable office coffee machines keep everything flowing.
- Use data to decide what deserves more space: Chicago's shift toward protein bars and functional beverages shows how quickly preferences can change. Compare your consumption data with industry benchmarks to see where your program stands, then use employee voting to understand what's missing. Together, those signals help you adjust quantities, introduce new favorites, and reduce spending on products employees aren't choosing.
Chicago Office Pantry FAQs
How much do Chicago offices spend on pantry programs?
Chicago offices spend an average of $19,715 per month on their pantry programs in 2026, or $11.56 per person per day. Spending rose every quarter, from $19,226 in Q1 to $20,253 in Q3, as more employees returned to the office.
What is the average cost per person per day for an office pantry in Chicago?
The average cost per person per day for a Chicago office pantry is $11.56 in 2026, alongside an average monthly spend of $19,715. Cost per person ranged from $11.81 in Q2 to $11.24 in Q3, dipping as more employees came in to share the pantry.
What are the most popular office snacks in Chicago?
Chicago’s top office pantry sellers in 2026 are Diet Coke, Prairie Farms Whole Milk, Nature’s Bakery Whole Wheat Fig Bars, LaCroix Pure, and SunChips. Local brands also lead their subcategories, including Big Shoulders cold brew, Aspire energy drinks, Think Jerky, and SkinnyPop.
How can I benchmark my office pantry in Chicago?
Start with cost per person per day, since it shows the experience you’re funding for each employee regardless of headcount. Then compare against Chicago offices in your industry and company type to see how you stack up against workplaces competing for the same talent. Our benchmarking guide walks through each step, including talk tracks to make the case for your budget.
What Chicago’s Pantry Data Means for Your Workplace
Chicago's workplace market is finding its rhythm again, but the way companies invest in their offices is still evolving. As attendance grows and expectations rise, the question for workplace leaders is how to keep pace without letting costs get ahead of them.
That's where the benchmarks come in. They give you a clearer picture of what companies across Chicago are spending, where priorities are shifting, and how your own program stacks up.
Explore the Pantry Intelligence Index to compare your spend with Chicago peers, identify opportunities, and build a stronger case for your next budget decision. We'll update these benchmarks every quarter as the market evolves.
Methodology Behind Crafty's Chicago Pantry Benchmarks
This analysis draws on Crafty-powered pantries across Chicago from January through September 2026. Figures reflect 2026 year-to-date unless noted, and the quarterly breakdown looks at each quarter on its own, so it may highlight different products than the year-to-date rankings. Spend figures are network averages in USD, and subcategories and best sellers are ranked by units delivered. Explore the full Chicago data in the Pantry Intelligence Index.
Related Resource

Blog
Office Snack Trends for 2027 from the Vistar North Show
October 27, 2026
Blog
Chicago Office Pantry Benchmarks in 2026 (Data Through September)
October 27, 2026

Blog
What Texas Offices Want in the Pantry, From Dallas to Austin and Houston
October 26, 2026
Blog
San Francisco Office Pantry Benchmarks 2026 (Data Through September)
October 26, 2026

Blog
Your Office Guide to the Types of Protein in Snacks
October 23, 2026

Blog
Equipment Guide: The Best Office Coffee Machines for Your Team
October 22, 2026

Blog
Best Low Carb Snacks for the Office Pantry
October 21, 2026

Blog
Office Pantry Services in Texas: How Crafty Is Growing Across Dallas, Austin & Houston
October 15, 2026

Blog
What Makes Fruit “Office-Ready”? From Farm Selection to Delivery Standards
October 15, 2026