min read
October 12, 2026
Inside Office Digest: How Crafty Measures Office Pantry Program Performance
We sat down with the team behind Crafty’s Office Digest to talk about why they built it, the decisions that shaped the first release, and where they see office pantry intelligence going next.


For a long time, office pantry programs had a visibility problem. Basic questions like “How are we spending?” or “How is our pantry performing?” often didn’t have data behind them at all.
Crafty has spent years changing that by bringing pantry performance data into the Crafty Platform. But as the amount of information available grew, a new challenge emerged: How do you make sure the right information is available at the exact moment someone needs it?
That question helped shape Office Digest, the latest addition to the Crafty Platform.
What is Office Digest?
Office Digest is a monthly overview of each office's pantry program performance, bringing key metrics, personalized product recommendations, market trends, and relevant Crafty Platform features into one easy-to-scan view.
Each month, workplace teams can see:
- Spending & Budget: Get a snapshot of your pantry spend, budget, and ordering activity.
- Pantry Performance: See what employees love, what’s moving, and where there’s room to improve.
- Trends & Recommendations: Explore market insights and product recommendations tailored to your pantry.
- Operations & Updates: Stay on top of support requests and discover helpful Crafty Platform features.
We sat down with a few members of our Product team to hear how Office Digest came together and where it’s headed.
- Allison Cuca, VP of Product
- Kelley Gessner, Sr. Product Manager
- Hollie Swidarski, Sr. Product Designer
- Jean Francois Boueri, Software Engineer II
Let’s jump in!
Why Did Crafty Build Office Digest?
Allison Cuca, VP of Product:
We’ve spent years putting data behind an industry that historically hasn’t had much of it. That was an important first step, but having the data and getting to an answer quickly are not the same thing.
Workplace leaders shouldn’t have to know which report to pull or spend time connecting the dots themselves. We wanted to take that work off their plates and bring the most important information forward in one place.
That’s really the vision for Office Digest. We want to make the right information easy to find, easy to understand, and useful in the moment someone needs it.
How Did You Decide What Belonged in the First Office Digest?
Kelley Gessner, Sr. Product Manager:
We were really intentional about keeping the first version focused. There are so many things we could show, but adding more information doesn’t always make something more useful. We kept coming back to one question: What does someone need to understand their month quickly?
We started with the questions we hear most often from workplaces:
- How much did we spend?
- How many orders and products does that include?
- How does our office compare?
- What should we pay attention to next?
From there, the flow felt pretty natural. Start with what happened, add some context, and then help workplaces figure out what to do next. That’s why the digest moves from a performance snapshot into product recommendations, market context, and relevant platform tools.
The bottom line was to make this a one-stop resource someone could scan and understand quickly, not another report they have to sit down and analyze.
How Did You Approach the Design?
Hollie Swidarski, Sr. Product Designer:
We wanted it to feel visual, easy to scan, and easy to act on. It shouldn’t feel like a dense report or something you need training to understand.
We used color and scale to draw attention to the most important stats first. Product photography makes the recommendations easier to recognize, and placing related information side by side helps people compare it without having to jump around the page.
We also thought about what someone might want to do after seeing each insight. It’s not enough to just show the data. We want people to understand why it matters and know what they can do next.
What Did it Take From an Engineering Perspective?
Jean Francois Boueri, Software Engineer II:
The main engineering challenge was bringing together data that had been built for different purposes. We already had pantry spend and order data, product information, recommendations, and market context, but they weren’t all structured to work together. We needed a reliable way to match the right information to a specific office and month.
Once those pieces are connected, Office Digest can do more than show a collection of numbers. It can put performance next to useful context and help connect what happened with what a workplace might want to do next. There’s a fair amount happening behind the scenes, but ideally the workplace leader doesn’t have to think about any of that. They just see one clear story.
How Does Office Digest Use Office Pantry Benchmarks?
Kelley Gessner, Sr. Product Manager:
We didn’t make that decision in a vacuum. We talked with the teams closest to our clients about the questions they hear, the data they actually use, and what helps workplaces make decisions. That was important because we wanted the market context to be useful, not just interesting.
The Crafty Pantry Intelligence Index gave us a strong starting point. It’s our first-of-its-kind benchmarking tool, built from data across hundreds of Crafty-powered workplaces. It shows how pantry spend, category performance, and product trends vary across markets, industries, and company sizes.
Then we had to make that information feel relevant to one specific office. We look at an office’s product and category data alongside the broader trends we’re seeing across Crafty-powered workplaces. AI helps us bring those signals together into tailored recommendations, so a workplace can see how they compare and what product or action might make sense to consider next.
How Does Office Digest Grow as More Data Becomes Available?
Hollie Swidarski, Sr. Product Designer:
What we have today gives us a flexible system to build on. Each section is modular, so we can add new information without the digest turning into one long, overwhelming report.
There are a lot of directions we could take it. We could use charts to show how an office is pacing against its budget over time. We could compare employee voting with what people actually consume, surface fast and slow movers, or suggest swaps when there’s an opportunity to improve the assortment.
We already have the design patterns to support those ideas. Now it’s about deciding what belongs in the monthly story and what will actually be useful. We want the digest to get smarter over time without making it harder to use.
How Can Workplace Leaders Prove the Value of Their Pantry Program?
Kelley Gessner, Sr. Product Manager:
I want them to feel confident, both in how they manage the pantry day to day and in how they talk about its value with leadership.
Workplace leaders and office managers are being asked to do more with less and explain every dollar they’re investing. We know pantry programs can have a meaningful impact on the employee experience, but that impact hasn’t always been easy to show. Office Digest puts the performance data, context, and opportunities in one place, so they can go into those conversations with evidence instead of anecdotes.
They should be able to show what the investment is accomplishing, explain the decisions they’re making, and identify where more support or budget could have the greatest impact. Ultimately, we want Office Digest to help them advocate for their pantry program and feel confident leading it.
Does Office Digest Change How We Define Pantry Performance?
Allison Cuca, VP of Product:
That’s the bigger opportunity. Across the industry, pantry programs have been measured in pretty broad terms. Did we stay on budget? Were the shelves stocked? Did employees seem happy? There hasn’t really been a shared definition of what good performance looks like, let alone what great looks like.
Spend is part of the story, but it isn’t a measure of success on its own. The better question is whether that investment is creating the workplace experience you intended. Are you choosing products employees value? Is the assortment performing the way you expected? Is the program supporting the goals you set for it?
Office Digest starts to connect those signals so workplace leaders can evaluate performance against their own vision, not just one budget number. Over time, I think Crafty has an opportunity to help define the KPIs for this category and give the industry a more meaningful standard. It’s not only about how much you spent. It’s about how well that investment worked.
What's Next for Office Digest
Office Digest is an important step toward a more intelligent way to measure and manage office pantry program performance.
Today, it brings each office’s core metrics, market context, and tailored recommendations into one clear monthly view. That gives workplace leaders faster answers, helps Crafty teams spend less time assembling reports and more time optimizing programs, and makes conversations more focused on decisions and action.
Over time, as budget, voting, consumption, and product movement signals come together, Office Digest can help define what effective pantry performance looks like. The goal is not simply to report how much was spent. It is to show how well that investment is delivering against the workplace experience each company wants to create.
Related Resource
Blog
Inside Office Digest: How Crafty Measures Office Pantry Program Performance
October 12, 2026
Blog
Equipment Guide: Cold Water Machines for the Office
October 8, 2026
Blog
How to Reduce Office Pantry Costs with 7 Optimization Tips
October 8, 2026
Blog
November Holidays for Work: Snack Celebrations for Your Breakroom
October 8, 2026
Blog
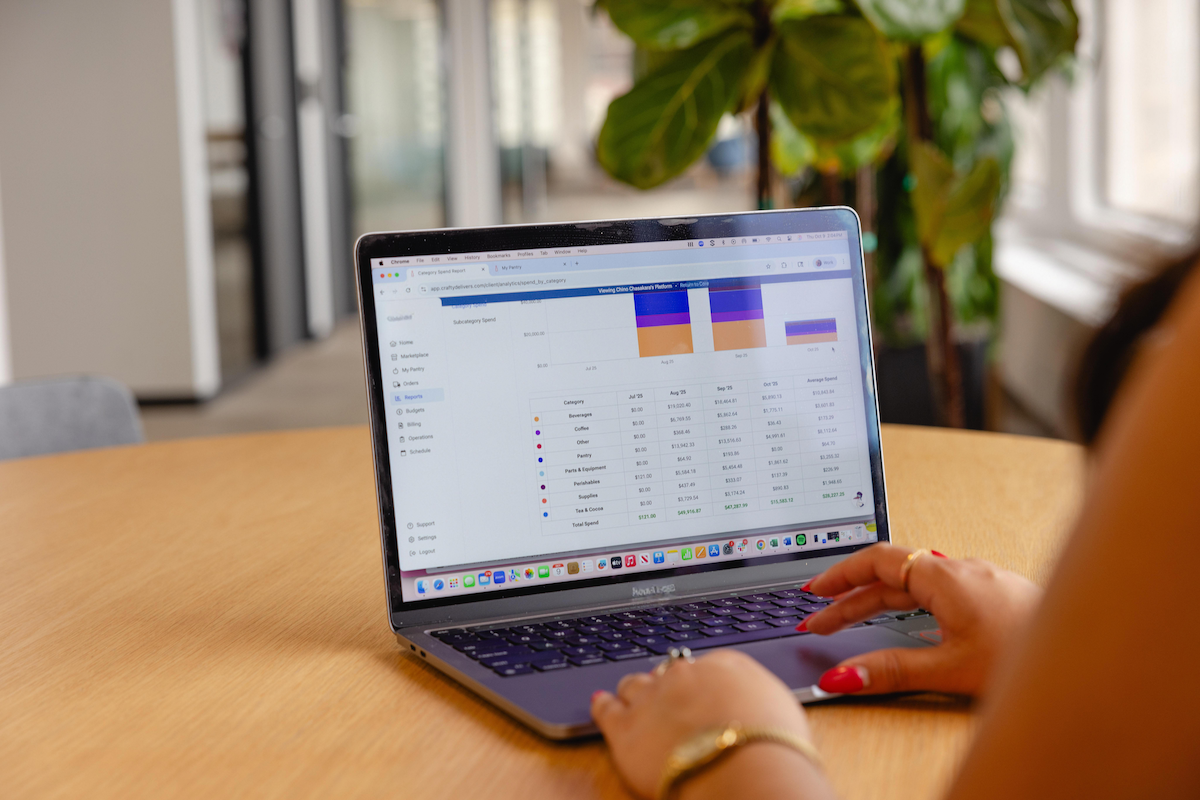
How to Benchmark Your Office Pantry and Make the Case for What You Need
October 7, 2026
Blog
Fueling the Season: Inside a Pro Sports Organization's Workplace Food Program
October 7, 2026
Blog
How Much Does an Office Pantry Cost per Employee: 3 Tiers for 2027
October 7, 2026
Blog
How to Calculate Your 2027 Office Snack Budget
October 7, 2026
Blog
The Insider's Guide to Choosing a National Office Coffee Service Provider in 2027
October 6, 2026