min read
October 29, 2026
New York City Office Pantry Benchmarks in 2026 (Data Through September)
New York City offices spend $13.03 per person per day on pantry programs in 2026. Here’s how NYC pantry spending breaks down by quarter, category, and product.


Getting employees into the office more often remained a priority for New York City employers in 2026. Finance and law firms led with stronger attendance expectations, while companies across industries invested in making the office worth the commute. Manhattan office leasing reached 32.9 million square feet through the first three quarters of 2026, its strongest start to a year since 2000, showing just how much employers were willing to invest in bringing people together.
American Express is one example of just how far those commitments extend. The company finalized a 2-million-square-foot lease at 2 World Trade Center, becoming the building's sole anchor tenant. Investments of this scale reflect a broader shift in how employers view the workplace. With competition for talent and premium office space intensifying, companies are betting that a better in-office experience will help attract employees and keep them coming back.
Those types of bets resulted in measurable gains in attendance. By July, New York office visits were within 6.2% of 2019 levels. In August, visits were up 8.9% year over year, outpacing every other major market. But as offices fill up, so does the pressure on workplace budgets. Employers are supporting more people throughout the workday while balancing rising expectations for the experience with the cost of delivering it.
That balance is especially visible across NYC office pantries, where attendance, employee preferences, and spending come together every day. Using data from the Crafty Pantry Intelligence Index, we're breaking down New York City's 2026 pantry spend, cost per person per day, and best-selling products to understand how employers are responding to these demands. We'll update these benchmarks every quarter as new data comes in.
Key Takeaways
- New York City offices spend $13.03 per person per day, about 20% above the national average: Even at a premium, per-person spend fell 4.5% from Q1 to Q3, so employers are investing more without letting costs run ahead of them.
- Budget optimization is a priority for 68% of NYC pantries: The Optimize It strategy focuses on stretching budgets through product swaps, inventory adjustments, and smarter purchasing. A slight dip in cost per person per day suggests these trade-offs are helping manage costs as attendance grows.
- Beverages took the lead in Q3: Drinks overtook snacks as the largest share of pantry spending, while coffee continued gaining ground as a workplace staple.
Average NYC Office Pantry Cost in 2026
New York City's push for more time in the office is showing up in both attendance and real estate. Office visits grew 4% year over year in the first half of 2026, while major employers continued making long-term commitments to the city. Law firm Simpson Thacher, for example, signed a 916,000-square-foot lease at 570 Fifth Avenue, one of Manhattan's largest deals of the year.
With more employees spending more of their week onsite, the everyday amenities that support them are getting more use. That includes the office pantry, where employers have to balance keeping teams fueled with managing the cost of a growing in-office population.
New York City Office Pantry Spend Year to Date
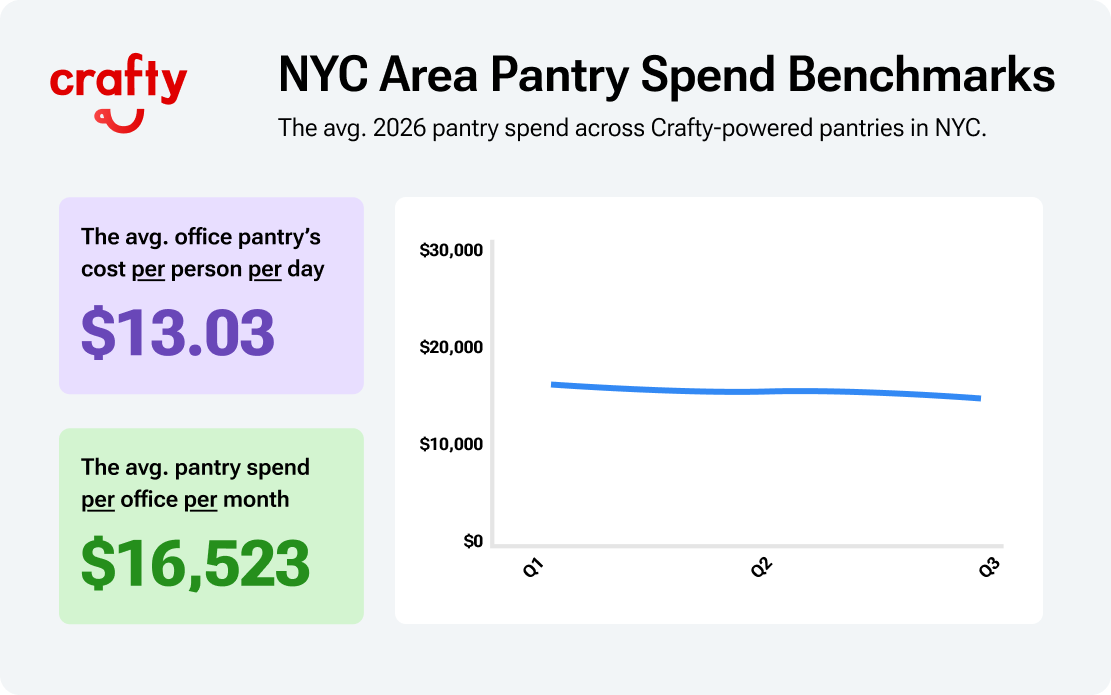
- Average monthly pantry spend per office: $16,523
- Average cost per person per day: $13.03
All figures reflect 2026 year-to-date unless noted by quarter. See methodology at the bottom.
For New York's finance, legal, and corporate teams, the pantry is part of the daily routine. Coffee for early starts, snacks between meetings, and something more filling when there's no time to step out. Cost per person per day puts a number on that experience, showing how much employers invest in pantry food and beverages for each employee on an average day.
New York's quarterly data shows how pantry spending has evolved throughout 2026, from shifting attendance patterns to changing priorities in what employers stock and spend.
New York Office Pantry Spend by Quarter
New York City has long set the pace for how the workplace evolves. From in-office attendance expectations to premium office experiences, decisions made by the city’s largest employers often signal where the broader market is headed. In 2026, New York office visits outpaced every major market in August, while employers kept a firm hand on in-office investments like the pantry.
At first glance, New York City’s dip in monthly pantry spend from Q1 to Q3 might suggest employers were cutting back. But as attendance and seasonal preferences shifted, employers adjusted their programs to get more from their budgets. In fact, 68% of NYC offices we serve follow Crafty’s Optimize It pantry budget strategy, using product swaps, inventory adjustments, and smarter purchasing to put more of their budgets toward what employees actually consume.
New York’s broader workplace market is shaping how employers invest in their pantries. From rising office attendance to competition for talent and premium space, here’s how those pressures are influencing pantry decisions.
New York City Workplace Trends Driving Pantry Investment
New York employers are rethinking what makes an office worth coming into and what it takes to deliver that experience. The pantry is part of that equation, with broader market pressures shaping how companies prioritize amenities, manage spending, and meet employee expectations.
- Office Attendance: NYC office visits grew 4% year over year in the first half of 2026, then accelerated to 8.9% in August, the fastest growth of any major market. More employees coming in more often means greater demand for everyday workplace amenities, making pantry consumption and stocking levels more important to get right.
- Hiring & Talent Competition: New York's unemployment rate fell to 5% in July, marking its fifth consecutive monthly decline. Meanwhile, the metro's 394,300 tech workers make it North America's largest tech talent pool, with finance and AI fueling demand for specialized skills. Employers competing for that talent are investing in workplace experiences that give employees more reasons to come in and stay.
- Office Leasing & Flight to Quality: Office space in Manhattan is getting harder to come by, with availability falling to 13.7% in Q3, down 290 basis points year over year. Companies are willing to pay for it, too. At One Vanderbilt, an AI company reportedly signed a lease at a record $320 per square foot. With that level of investment, expectations extend beyond the building itself. Employers need amenities, including the pantry, that make the space worth showing up for.
Let’s take a closer look at the top industries driving these trends and how they’re investing in their workplace pantries.
Which NYC Industries Invest Most in Office Pantries?
New York is home to some of the country's most competitive industries, where long hours, demanding schedules, and high expectations shape the workday. In 2026, finance, technology, and law firms accounted for 70% of Manhattan office leasing, signaling continued investment in the workplace. For employers, that means creating an experience that keeps teams fueled, focused, and productive. Let’s take a closer look at how these industries are shaping New York’s workforce and the workplace experiences employees expect.
Pantry Spend in NYC’s Top Industries: Tech, Finance, and Law
- Technology: New York's tech sector is growing fast, with companies leasing 4.15 million square feet in the first half of 2026, up 59.5% year over year. AI companies are helping drive that growth, bringing more specialized talent into Manhattan offices. Crafty's pantry benchmarks show technology firms investing $10.53 per person per day nationally, with AI & Data teams stocking protein-rich options like Barebells and fairlife alongside CELSIUS, green tea, and coconut water to keep employees fueled and focused.
- Financial Services: Wall Street had a strong start to 2026, generating $45.9 billion in pretax profits, up 51.3% year over year. With busy trading floors and demanding schedules, employees need food and drinks that keep up. Financial Services leads Crafty's major industries at $12.91 per person per day nationally, while Markets & Trading firms invest $20.83, favoring Barebells, fresh fruit, Organic Valley milk, and sparkling water.
- Professional Services: Law firms are expanding their Manhattan presence, accounting for 17.1% of office leasing in 2026, up from 11% last year. For attorneys and consultants balancing client meetings, deadlines, and billable hours, convenience is a priority. Professional Services firms invest $7.47 per person per day nationally, with Advisory & Consulting teams spending 48.1% of their pantry budgets on grab-and-go snacks like Barebells, HIPPEAS, and Welch's Fruit Snacks.
Pantry Spend by Company Type: SaaS, AI, and Investment Firms
- SaaS: New York's software companies are expanding their office presence. In March, SaaS provider Datasite opened a new office at 3 Columbus Circle to support its growing AI-powered businesses. For teams balancing product development, client demands, and tight deadlines, convenience matters. Our pantry data shows SaaS companies investing $11.49 per person per day, with quick favorites like Barebells Cookies and Cream, La Colombe Cold Brew, and Diet Coke keeping employees fueled between meetings.
- AI & Data: AI companies are taking up more space in Manhattan, leasing over 2.2 million square feet in the first half of 2026, more than double their total for all of 2025. With companies growing quickly and competing for specialized talent, the pantry needs to support demanding workdays. AI & Data firms invest $9.50 per person per day, favoring protein-rich options like Barebells and fairlife alongside CELSIUS, green tea, and coconut water.
- Investment Firms: Investment firms are also committing to premium NYC offices. In July, HarbourVest Partners signed a nearly 20,000-square-foot lease at 9 West 57th Street for its first New York office. For teams moving between deal reviews, financial modeling, and client meetings, having food close by makes a difference. Crafty's Q3 benchmarks show Investment Firms spending $13.20 per person per day, with coffee staples like Starbucks Pike Place Roast and Nespresso alongside filling options like Fage yogurt and Sahale trail mix.
Each industry brings different needs to the pantry. NYC’s category data shows where those priorities translate into spending.
NYC Office Pantry Budget by Category
New York is an expensive place to work, and the rising cost of food is making everyday purchases add up fast. A coffee, breakfast, and afternoon snack can easily cost employees around $20 a day. That's $100 a week just to stay fueled at work.
For employers, a well-stocked pantry can help offset those costs while making the office a more attractive place to spend the day. And with Snacks & Pantry and Beverages accounting for two-thirds of New York's pantry spend, it's clear where much of that investment is going.
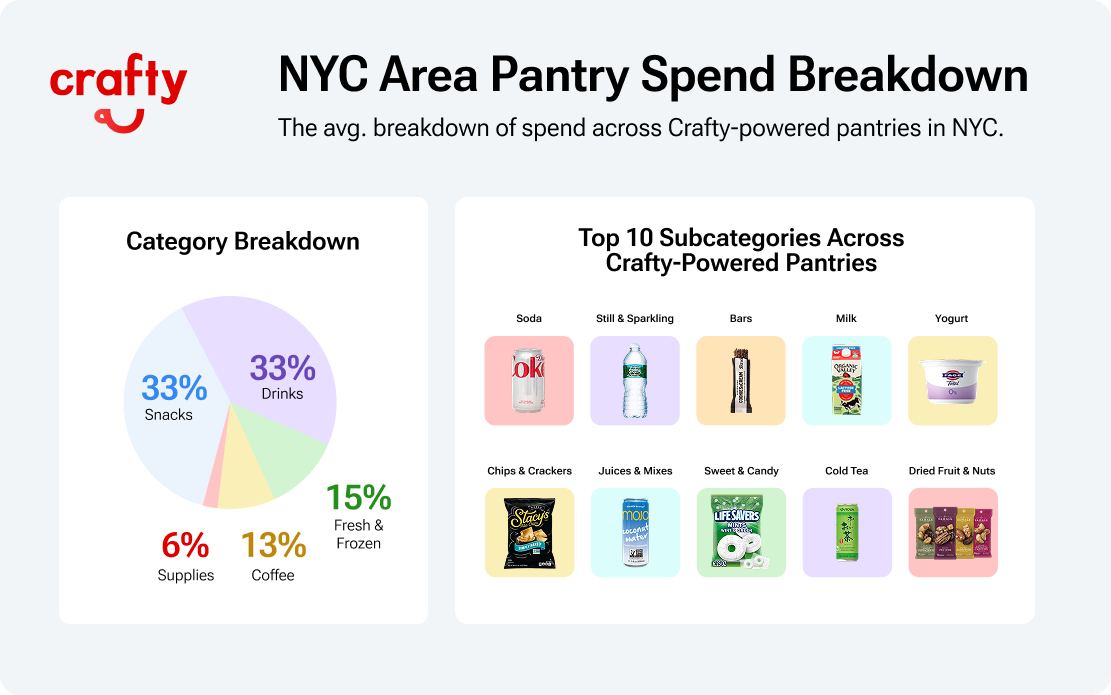
Share of Pantry Spend by Category
- Snacks & Pantry: 33%
- Beverages: 33%
- Fresh & Frozen: 15%
- Coffee: 13%
- Supplies: 6%
Top 10 Office Pantry Subcategories in NYC
- Sodas
- Still & Sparkling Water
- Bars
- Milk & Alternatives
- Yogurt
- Chips & Crackers
- Juices & Mixers
- Sweets & Candy
- Cold Tea
- Dried Fruit, Nuts & Seeds
2026 NYC Office Pantry Trends to Watch
- Drinks are claiming more of the budget: Beverages and Coffee grew from 44.5% of spend in Q1 to 47.1% in Q3, with Coffee gaining share every quarter. Cold coffee is becoming a year-round habit rather than just a summer treat, with specialty coffee consumption reaching a record 48% of adults nationally. La Colombe Cold Brew remained a top-15 favorite in New York throughout Q2 and Q3, showing how café-style drinks are becoming part of the everyday office routine, without the expensive coffee run.
- Snacks are turning into small meals: Between back-to-back meetings and busy schedules, sitting down for a full lunch isn't always realistic. In fact, 41% of snack consumers now replace regular meals with snacks. In the city that never sleeps, it's not surprising to see that in the pantry mix. Fresh & Frozen grew from 14.6% in Q1 to 15.3% in Q3, with Deli & Prepared jumping from #14 to #9. Vital Farms Pasture-Raised Eggs, Smucker's Uncrustables, and Dave's Killer Bread give employees more ways to put together something filling without leaving the office.
- Protein is moving beyond shakes: The demand for protein isn't going anywhere, but employees are finding more ways to get it. With 70% of Americans actively trying to include protein in their diets, everyday foods like yogurt, milk, and bars are becoming easy ways to meet that goal. In NYC, Sports & Protein Drinks ranked #10 in Q1 before dropping out of the top 10, while Milk & Alternatives stayed in the top four, Yogurt held #5, and Barebells kept Bars near the top. Employees are still prioritizing protein, just in more familiar, versatile forms like Fage, Chobani, and Organic Valley.
- Everyday favorites hold their ground: For all the interest in healthier snacks and functional beverages, sometimes employees just want their Diet Coke. It led Sodas throughout 2026, while Life Savers Wint-O-Green, ITO EN Oi Ocha, and MOJO Organics held their category leads. And there's a reason those familiar favorites stick around. For the first time, convenience outranked healthfulness as a food purchase driver. For New York employers, the opportunity is to protect the products employees already love while using consumption data to introduce new favorites like HIPPEAS.
Now, let’s take a closer look at the products behind these trends and which favorites are leading New York’s pantries.
Most Popular Office Snacks and Drinks in NYC
New Yorkers know what they like, and their office pantries are no exception. Everyday essentials like Diet Coke, Poland Spring, and Barebells protein bars dominate the best-seller list, but NYC local brands have a place, too. Long Island-born Tate's Bake Shop leads Cookies, while Sabra tops Spreads and Lesser Evil takes the top spot in Popcorn & Pretzels. It's a mix of national staples and local favorites that reflects how New Yorkers eat, drink, and snack throughout the workday.
NYC Pantry Subcategory Rankings and Best Sellers (2026 to Date)
- Sodas: Diet Coke
- Still & Sparkling Water: Poland Spring Natural Spring Water
- Bars: Barebells Cookies and Cream Protein Bar
- Milk & Alternatives: Organic Valley Organic Milk
- Yogurt: Fage Total 0% Plain Greek Yogurt
- Chips & Crackers: Stacy’s Simply Naked Pita Chips
- Juices & Mixers: MOJO Organics Pure Coconut Water
- Sweets & Candy: Life Savers Wint-O-Green Mints
- Cold Tea: ITO EN Oi Ocha Unsweetened Green Tea
- Dried Fruit, Nuts & Seeds: Sahale Snacks Trail Mix
- Sports & Protein Drinks: fairlife Core Power Protein Shake
- Deli & Prepared: Vital Farms Pasture-Raised Eggs
- Flavored & Infused Water: Hint Blackberry
- Sweeteners & Creamers: Organic Valley Half and Half
- Cold Brew & Iced Coffee: La Colombe Cold Brew
- Popcorn & Pretzels: Lesser Evil Organic Popcorn
- Breakfast: Cheerios Honey Nut
- Produce: The FruitGuys Organic Fruit
- Energy Drinks: CELSIUS Peach Mango
- Cookies: Tate’s Bake Shop Tiny Chocolate Chip Cookies
- Pods & Capsules: Nespresso Espresso Forte
- Hot Tea: Tazo Organic Zen
- Kitchen & Dining: Bounty Select-A-Size Paper Towels
- Jerky: Think Jerky Original Beef Jerky
- Coffee & Coffee Beans: Starbucks Pike Place Roast
- Condiments: Justin’s Classic Peanut Butter
- Spreads: Sabra Classic Hummus
- Cleaning Products: Bounty Paper Napkins
- Kombucha: GT’s Kombucha Synergy
- BiBs & Fountain: Bevi Vitamin Boost
- Instant Meals: Nongshim Shin Ramyun
- Breads: Dave’s Killer Bread
- Personal Care: Emergen-C Super Orange
- Frozen: Smucker’s Uncrustables
- Event Essentials: World Centric Compostable Utensils
So, what can you take from New York's pantry trends and apply to your own office? Here are a few ways to put the data to work.
How to Use NYC Benchmarks to Improve Your Office Pantry
New York's pantry trends offer a few lessons worth borrowing. Give employees options that work with their schedules, keep the coffee station interesting, and find new ways to refresh the favorites they already love.
- Build a pantry for filling moments on the go: Employees need options they can grab between meetings, but those same products should also work together when they want something more substantial. Think individual yogurts, nuts, fruit, and instant meals that can become a filling, nutritious meal with a little creativity. One of our favorite Crafty Snack Hacks is upgrading a cup of ramen with a hard-boiled egg and seaweed for extra protein and flavor. It's an easy way to get more out of the products you're already stocking.
- Invest in your coffee culture: New Yorkers clearly love a good cup of coffee, but that doesn't mean the station should look the same all year. Keep your everyday favorites stocked, then mix things up with seasonal syrups, creamers, and toppings. Think lavender and vanilla iced lattes in spring, maple cold brew in fall, or peppermint mochas during the holidays. A few small additions can turn the daily coffee run into something employees look forward to.
- Protect the favorites, but experiment with flavors: If your team loves Barebells protein bars, keep their go-to flavors stocked and rotate a few new ones throughout the year. Bring in pumpkin spice or apple cinnamon for fall, peppermint and chocolate for winter, or spotlight brands and flavors during cultural heritage celebrations. Use Employee Voting to find out which new options deserve a permanent spot. That way, employees can count on their favorites while still having something new to discover.
New York City Office Pantry FAQs
How much do New York City offices spend on pantry programs?
New York City offices have spent an average of $16,523 per month on pantry programs so far in 2026, or $13.03 per person per day. Monthly spending ranged from $16,896 in Q1 to $16,239 in Q3.
What is the average cost per person per day for an office pantry in New York City?
The average cost per person per day was $13.03 across the first three quarters of 2026. It reached $13.55 in Q1, dropped to $12.70 in Q2, and rose slightly to $12.94 in Q3. This metric helps you understand how much you're investing in each employee, regardless of office size or attendance.
What are the most popular office snacks in New York City?
Diet Coke, Poland Spring water, Barebells Cookies and Cream protein bars, Organic Valley milk, and Fage Greek yogurt lead New York's pantry rankings. NYC local brands and regional favorites also have a strong presence, including Tate's Bake Shop cookies, Sabra hummus, and Lesser Evil popcorn.
How can I benchmark my office pantry in New York City?
Start with your cost per person per day and compare it with New York’s 2026 year-to-date average of $13.03. Then look at how your industry and company type use the pantry to see where your program is ahead or behind. Our benchmarking guide walks through each step.
What New York City’s Pantry Data Means for Your Workplace
New York is finding its office rhythm again, but the cost of keeping up is higher than ever. Between rising everyday expenses, competition for talent, and growing expectations for the workplace, employers have to be more thoughtful about where they invest.
The pantry is one place where those decisions make a difference. New York's data shows employees still count on their everyday favorites, but they're also looking for filling options, better coffee, and more convenience throughout the day. The opportunity is to deliver more of what employees value while making every dollar count.
Explore the Pantry Intelligence Index to see how your office compares with New York City peers and build a stronger case for the budget you need. We'll update these benchmarks every quarter so you can keep pace with what's changing.
Methodology Behind Crafty's NYC Pantry Benchmarks
This analysis draws on Crafty-powered pantries across the New York City area from January through September 2026. Figures reflect 2026 year-to-date, and the quarterly breakdown looks at each quarter separately, so quarterly rankings and best sellers may differ from year-to-date results. Spend figures are network averages in USD, and subcategories and best sellers are ranked by units delivered. Budget strategy data reflects New York City offices served by Crafty as of Q3 2026. Explore the full NYC data in the Pantry Intelligence Index.
Related Resource
Blog
New York City Office Pantry Benchmarks in 2026 (Data Through September)
October 29, 2026

Blog
Office Snack Trends for 2027 from the Vistar North Show
October 27, 2026
Blog
Chicago Office Pantry Benchmarks in 2026 (Data Through September)
October 27, 2026

Blog
What Texas Offices Want in the Pantry, From Dallas to Austin and Houston
October 26, 2026
Blog
San Francisco Office Pantry Benchmarks 2026 (Data Through September)
October 26, 2026

Blog
Your Office Guide to the Types of Protein in Snacks
October 23, 2026

Blog
Equipment Guide: The Best Office Coffee Machines for Your Team
October 22, 2026

Blog
Best Low Carb Snacks for the Office Pantry
October 21, 2026
Blog
Office Pantry Services in Texas: How Crafty Is Growing Across Dallas, Austin & Houston
October 15, 2026