min read
November 19, 2026
Los Angeles Office Pantry Benchmarks in 2026 (Data Through September)
Los Angeles offices have invested $8.68 per person per day in pantry programs so far in 2026. Here’s how that investment breaks down by quarter, industry, and product.


Los Angeles works across a map of office hubs. Teams are spread across Century City, Santa Monica, Culver City, Downtown, and Pasadena, and every trip in competes with one of the country’s toughest commutes. As more companies bring people back, workplace leaders have to make that drive worth it, and every line of the budget is getting a closer look.
Some of LA’s biggest employers are betting on the office anyway. Office leasing reached 4 million square feet in Q3 2026, the most since 2019. Renewals made up six of the 10 largest deals, a sign that companies are recommitting to their space for the long haul. Commitments like that show employers believe a better workplace is worth the investment.
So how much are Los Angeles companies investing in their office pantries? Powered by the Crafty Pantry Intelligence Index, this page breaks down average pantry spend across Los Angeles offices, cost per person per day, and the products employees reach for most. Updated quarterly, these benchmarks give workplace leaders a clearer picture of the local market and the data they need to evaluate spending, optimize their programs, and make smarter investment decisions.
Key Takeaways
- Los Angeles pantry spend grew 4.2% from Q1 to Q3, averaging $10,499 per office per month in 2026: With LA leading major markets in office visit growth during the first half of 2026, rising attendance is creating greater demand for workplace food and beverages.
- Cost per person per day remained relatively steady at $8.56 in Q3, compared to $8.55 in Q1: Offices are spending more overall while keeping per-employee costs consistent, signaling that pantry programs are scaling efficiently as attendance increases.
- Beverages gained share every quarter: With Still & Sparkling Water ranking #1 every quarter, LA offices are putting more of their pantry budgets toward drinks that keep employees hydrated through long days.
How Much Do Los Angeles Offices Spend on Pantry Programs?
LA office visits grew 13% year over year in the first half of 2026, the largest increase among major markets. Companies are also holding onto more of their office space, with available sublease inventory declining for seven consecutive quarters. As employers recommit to their workplaces and more employees spend time in the office, the focus is increasingly on making those spaces worth the investment.
Los Angeles Office Pantry Spend Year to Date
- Average monthly pantry spend per office: $10,499
- Average cost per person per day: $8.68
All figures reflect 2026 year-to-date unless noted by quarter. See methodology at the bottom.
In Los Angeles, a long commute is part of the workday for many employees. Drivers lost 87 hours to traffic in 2025, making the trip into the office a major consideration for workplace leaders. For employees arriving after a long drive, the pantry is often one of their first stops for a morning coffee, a quick breakfast, or something to get them through the day.
Those everyday moments are part of what makes the workplace experience worth investing in. But for workplace leaders, the challenge is delivering an experience employees value while keeping spending aligned with the budget. That's where cost per person per day comes in. It measures the average pantry investment per employee for each day the office is open, making it easier to compare programs regardless of office size or attendance.
The year-to-date numbers set the baseline. The quarterly view shows how Los Angeles got there.
Los Angeles Office Pantry Spend by Quarter
Los Angeles pantry spend grew 4.2% from Q1 to Q3, reflecting a broader shift in how companies are investing in their workplaces. Across LA, employers are prioritizing Class A office space in markets like Century City. But to make that investment pay off, especially in a competitive talent market, companies also need to invest in the employee experience inside those buildings. The pantry is that daily touchpoint that almost every employee interacts with at least once a day.
We saw pantry investment grow alongside office traffic. Monthly spend rose from $10,115 in Q1 to a high of $10,805 in Q2, then settled at $10,539 in Q3. Meanwhile, LA led the country in year-over-year office visit growth for much of the year. Throughout those spend fluctuations, cost per person per day remained relatively steady, finishing Q3 at $8.56 compared to $8.55 in Q1. That signals LA offices are scaling pantry programs to support growing attendance without compromising the investment in each employee's experience.
Across the first three quarters, LA offices increased their pantry investment while keeping per-person costs relatively steady. Employee preferences also shifted toward beverages and fresh food. A closer look at LA’s workplace market helps put those trends into context and shows where employers are focusing their investments.
Los Angeles Workplace Trends Driving Pantry Investment
LA’s office recovery is real, and it’s uneven. More employees are coming in, competition for specialized talent is holding firm, and companies are concentrating in fewer, better buildings. Together, these trends are raising the bar for what a day in the office should deliver.
- Office Attendance: Los Angeles has led the country in office visit growth for much of 2026, and that momentum looks lasting, supported by stricter in-office policies at entertainment giants like NBCUniversal and Disney. As more employees settle into regular in-office schedules, pantries need to scale with attendance and show employees the commute was worth it.
- Hiring & Talent Competition: Demand for specialized skills is growing, with LA and Orange County now home to 28,600 AI-skilled workers. As tech, entertainment, finance, and professional services firms compete for the same people, the workplace becomes part of the offer. Talent with options expects an office worth showing up for.
- Office Leasing & Flight to Quality: Demand for premium office space continues to outpace the broader LA market. Trophy office vacancy was just 13.8% in Q3, while Class A rents averaged $3.79 per square foot, compared to $3.50 across the market. As companies invest more in higher-quality office space, they're also raising the bar for the employee experience. From food and beverages to everyday amenities, the workplace needs to deliver on that investment.
These trends are shaping how LA’s biggest industries invest in the workplace and their pantry programs.
Which Los Angeles Industries Invest Most in Office Pantries?
Los Angeles has a diverse economy spanning entertainment, aerospace, finance, and technology. Financial services firms led office leasing in Q3, accounting for 27.4% of leased space with an identified industry. Looking at LA's pantry data, many of the leading industries and company types have something in common: fast-paced, deadline-driven environments where employees need convenient access to food and beverages to keep up with the demands of their day.
Top 3 Los Angeles Industries Investing in Office Pantries
- Technology: LA tech companies compete for talent by creating campus-style workplaces built for collaboration and innovation. In August, Dotmo, an AI startup spun out of Snap, chose Culver City for its first headquarters, drawn to the area's walkable, amenity-rich environment. Inside the office, each company extends that amenity-rich feel to the pantry with a functional mix of snacks and beverages.”
- Professional Services: In this industry, the office is where relationships are built, talent is developed, and business gets done. PwC signed a 15-year lease in Century City, reinforcing the value of in-person work. The pantry plays a role in that experience, where companies prioritize a broad assortment that appeals to diverse preferences and reinforces the service level.
- Financial Services: In finance, early market openings, time-sensitive decisions, and long hours shape the workday. Bank of America signed Q2’s largest LA lease, a 137,873-square-foot renewal and expansion at Century Park Plaza, doubling down on in-person work. To keep pace, firms stock their pantries with protein-rich snacks, fresh food, and convenient breakfast options that support early starts and keep teams fueled through long days.
Top 3 Los Angeles Company Types Investing in Office Pantries
- Consumer Platforms: For consumer platforms, creativity, collaboration, and staying ahead of consumer trends shape the workplace experience. When Tinder moved its team back to its West Hollywood headquarters, it invested in an office built around perks, from Lego stations to a well-stocked pantry and drinks on tap. That same mindset carries into the pantries of similar companies. Businesses that make a living anticipating consumer trends are bringing that expertise into the workplace, prioritizing emerging snack brands, trending beverages, and fresh food options as they emerge.
- AI & Data: For AI and data companies, rapid innovation, deep focus, and constant experimentation shape the workday. LA's growing AI community was on full display in October, when Santa Monica and Venice hosted nearly 300 events during LA Tech Week. That same fast-moving culture extends into the pantries of AI companies. Teams working at the forefront of innovation are prioritizing functional beverages, hydration, and convenient snacks that support long development cycles and the demands of building what's next.
- Legal: For law firms, client expectations, billable hours, and demanding deadlines make every minute valuable. Milbank recently moved its LA team into the newly renovated Anderson Towers in Century City. That investment in a premium workplace reflects the high standards firms place on their people and their time. With long research sessions and demanding caseloads, legal offices prioritize protein-rich snacks, grab-and-go options, and everyday essentials that minimize time away from billable work.
From functional beverages to convenient snacks, LA's industries are shaping what goes into the pantry. Here's how those priorities are reflected in spending.
Los Angeles Office Pantry Spend by Category
Across Los Angeles pantries, beverages and snacks account for well over half of total spend and are growing every quarter. In a city where employees already face long commutes, a well-stocked pantry means they don't have to get back in the car just to grab coffee, lunch, or a snack.
How Los Angeles Pantry Budgets Split by Category
- Beverages: 31%
- Snacks & Pantry: 30%
- Supplies: 14%
- Coffee: 13%
- Fresh & Frozen: 12%
Top 10 Office Pantry Subcategories in Los Angeles
- Still & Sparkling Water
- Bars
- Sodas
- Milk & Alternatives
- Produce
- Dried Fruit, Nuts & Seeds
- Chips & Crackers
- Kitchen & Dining Supplies
- Sweeteners & Creamers
- Juices & Mixers
Los Angeles Office Pantry Trends to Watch
- Hydration is becoming a workplace essential: LA's extended heat wave pushed temperatures into the 90s and 100s well into fall, making hydration a priority beyond summer. Beverages gained 3.7 percentage points of pantry spend from Q1 to Q3, with Still & Sparkling Water holding the #1 spot. From coconut water to electrolyte drinks, LA's demand reflects a national shift, with hydration claims on new products up 39% over five years.
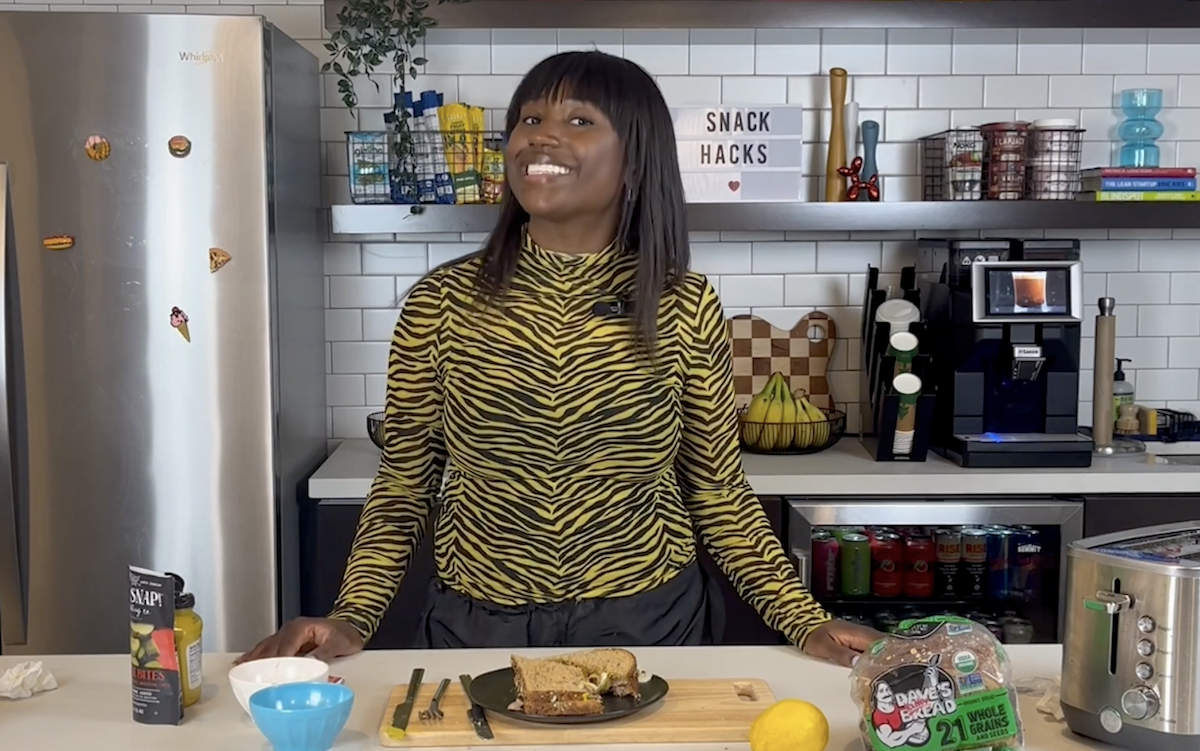
- The office pantry is becoming a lunch destination: With LA's long commutes, employees have another reason to skip the lunch run. Nationally, 41% of snack consumers now eat snacks in place of a regular meal. In LA, that means getting creative with snack-lunches, from hard-boiled eggs on Dave's Killer Bread to Chobani with bananas and granola. LA companies are responding to that demand, allocating more of their pantry budgets to snacks and prepared foods that can double as meals.
- Brand loyalty is up for grabs: LA employees are keeping their options open, with several products rising to #1 in their subcategories for the first time this year. Still & Sparkling Water had a different leader every quarter, while Long Beach-based C2O overtook Vita Coco and Frito-Lay Classic Mix displaced Stacy’s Pita Chips. In a city ranked among the top foodie destinations, that appetite for discovery extends to the office pantry. For workplace teams, it's an opportunity to test new products, track demand, and let employees vote on what earns a permanent spot.
- Familiar favorites anchor the daily routine: LA employees may love discovering new products, but they still want the staples they can count on. Sodas climbed two spots to become the #2 subcategory, led by Diet Coke. Nature's Bakery fig bars, Honey Nut Cheerios, and Starbucks Caffè Verona also held their top positions throughout the year. With taste remaining the biggest driver of food purchases, workplace teams need to make room for new discoveries without disrupting the favorites employees reach for every day.
So which products are earning their place on LA's pantry shelves? The latest rankings reveal what's resonating with employees.
Best-Selling Office Pantry Products in Los Angeles
LA's best sellers reflect a workforce that values wellness, convenience, and variety without giving up familiar favorites. Local California snack brands compete alongside national staples, while functional beverages, organic products, and grab-and-go foods show how employee preferences are shaping the everyday pantry.
Los Angeles Pantry Subcategory Rankings and Best Sellers (2026 to Date)
- Still & Sparkling Water: Maison Perrier Sparkling Water
- Bars: Nature’s Bakery Whole Wheat Fig Bar
- Sodas: Diet Coke
- Milk & Alternatives: Horizon Organic 2% Reduced Fat Milk
- Produce: Bananas
- Dried Fruit, Nuts & Seeds: Solely Fruit Jerky Mango
- Chips & Crackers: Frito-Lay Classic Mix Variety Pack
- Kitchen & Dining Supplies: Dixie Lunch Napkins
- Sweeteners & Creamers: Organic Valley Half and Half
- Juices & Mixers: C2O Pure Coconut Water
- Hot Tea: Tazo Zen
- Sweets & Candy: Trident Original Flavor Gum
- Yogurt: Chobani 0% Greek Yogurt
- Breakfast: Honey Nut Cheerios
- Coffee & Coffee Beans: Starbucks Caffè Verona
- Deli & Prepared: Almark Foods Hard-Boiled Eggs
- Cold Tea: ITO EN Jasmine Green Tea
- Energy Drinks: CELSIUS Tropical Vibe
- Popcorn & Pretzels: Lesser Evil Organic Popcorn
- Cold Brew & Iced Coffee: La Colombe Cold Brew
- Cookies: Nabisco Variety Pack
- Flavored & Infused Water: Hint Watermelon
- Sports & Protein Drinks: fairlife Core Power Chocolate Protein Shake
- Pods & Capsules: Starbucks Caffè Verona
- Spreads: Kirkland Signature Organic Peanut Butter
- Jerky: Archer Mini Beef Sticks
- Condiments: Justin’s Classic Almond Butter
- Breads: Dave’s Killer Bread
- Kombucha: GT’s Synergy Kombucha
- BiBs & Fountain: Bevi Electrolytes
- Cleaning Products: Nespresso Recycling Bag
- CO2 & Nitrogen: 25 Cu. Ft. Nitrogen Tank
- Instant Meals: Maruchan Instant Lunch
- Frozen: Smucker’s Uncrustables
- Personal Care: Emergen-C Super Orange
The rankings reveal a balance between discovery and routine. LA employees are open to trying new products, but consistent demand for everyday staples shows that familiarity still matters. The strongest pantry assortments make room for both.
The real value of these rankings is knowing what to do with them. Here's how LA workplace teams can turn local spending and product trends into smarter pantry decisions.
How to Use Los Angeles Benchmarks to Improve Your Office Pantry
LA's pantry data reveals three opportunities to improve your assortment without increasing complexity or spend. Here's where to start.
- Test new ways to hydrate: LA employees are reaching for drinks that do more than quench thirst. Test coconut water or electrolyte drinks that offer an extra hydration boost, then rotate flavors seasonally to keep the selection fresh. The beauty of this category is that you can introduce new flavors without significantly changing your cost per unit. Start with a few options, track consumption, and keep rotating based on what employees prefer.
- Choose snacks that work double duty: Start with versatile staples like hard-boiled eggs, yogurt, fresh fruit, and bread that work on their own or together. Try a few high-protein recipes using products already stocked, then add one or two complementary ingredients based on what's missing. Small additions can create more meal options without significantly expanding your assortment.
- Make discovery part of the experience: LA employees love trying new products, so give them something to look forward to. Establish a regular cadence for introducing new snacks, beverages, or local brands that employees can count on. Use employee voting to let employees weigh in on their favorites, then track consumption to decide what earns a permanent spot. A consistent rotation keeps the pantry exciting without constantly expanding your assortment.
Los Angeles Office Pantry FAQs
How much do Los Angeles offices spend on pantry programs?
Los Angeles offices spent an average of $10,499 per month on pantry programs through Q3 2026, or $8.68 per person per day. Monthly spending increased 4.2% from Q1 to Q3, reflecting continued investment in workplace food and beverages. Explore the latest figures in the Pantry Intelligence Index.
What is the average cost per person per day for an office pantry in Los Angeles?
LA offices averaged $8.68 per person per day through Q3 2026. Despite fluctuations in monthly spending, per-person costs remained relatively stable throughout 2026 so far. That consistency shows how workplaces can support changing attendance levels while maintaining control over per-employee spending.
What are the most popular office snacks in Los Angeles?
LA's most popular pantry products include Maison Perrier sparkling water, Nature's Bakery Whole Wheat Fig Bars, Diet Coke, Horizon Organic 2% milk, and bananas. California brands also stand out, including GT's Kombucha, C2O coconut water, and Hint. Together, these favorites reflect demand for hydration, convenient snacks, and familiar staples.
How can I benchmark my office pantry in Los Angeles?
Start by comparing your cost per person per day with LA's $8.68 average. Then review spending by category, product performance, and employee preferences to identify opportunities to optimize your assortment. Compare your results with similar industries and company types to account for differences in workplace needs. Our office pantry benchmarking guide walks through the process.
What Los Angeles Pantry Data Means for Your Workplace
LA companies are investing in better workplaces, and pantry spending is growing alongside that commitment. But the real opportunity is getting more value from every dollar. From functional hydration to convenient meal options and emerging brands, employee preferences are creating new ways to improve the pantry experience without driving up costs.
These benchmarks give workplace leaders a clearer picture of where LA companies are investing, how employee preferences are changing, and where small adjustments can make a meaningful difference.
Explore the Pantry Intelligence Index to compare your spending, evaluate your program, and make more informed budget decisions. Check back each quarter for the latest LA benchmarks.
Methodology Behind Crafty’s Los Angeles Pantry Benchmarks
This analysis draws on Crafty-powered pantries across the Los Angeles area from January through September 2026. Figures reflect 2026 year-to-date, and the quarterly breakdown looks at each quarter on its own, so quarterly rankings and best sellers may differ from year-to-date results. Spend figures are network averages in USD, and subcategories and best sellers are ranked by units delivered. Explore the full Los Angeles data in the Pantry Intelligence Index.
Related Resource
Blog
Los Angeles Office Pantry Benchmarks in 2026 (Data Through September)
November 19, 2026

Blog
How to Make the Office Worth the Commute: 5 Workplace Leaders Share What Works
November 18, 2026

Blog
2027 Office Pantry Trends: 10 Predictions and Our 2026 Report Card
November 18, 2026
Blog
Data Bites: The Most Popular Holiday Office Snacks
November 18, 2026

Blog
Best Colorado Snack Brands to Stock in Your Office Pantry
November 17, 2026

News
Crafty Hires Workplace Refreshment Veteran Dion Santo as Bay Area General Manager
November 12, 2026

Blog
Best Texas Snack and Coffee Brands to Stock in Your Office Pantry
November 11, 2026

Blog
Snacky Hour Episode 3 Recap: Poshi Veggie Snacks Review
November 9, 2026
Blog
High-Protein Recipes for Work: Easy Snack Hacks from the Office Pantry
November 6, 2026