min read
February 20, 2026
Data Bites: Historical Office Pantry Spend Trends in 2025
Crafty’s proprietary platform data across hundreds of workplaces reveals how organizations invest in workplace experience throughout the year.

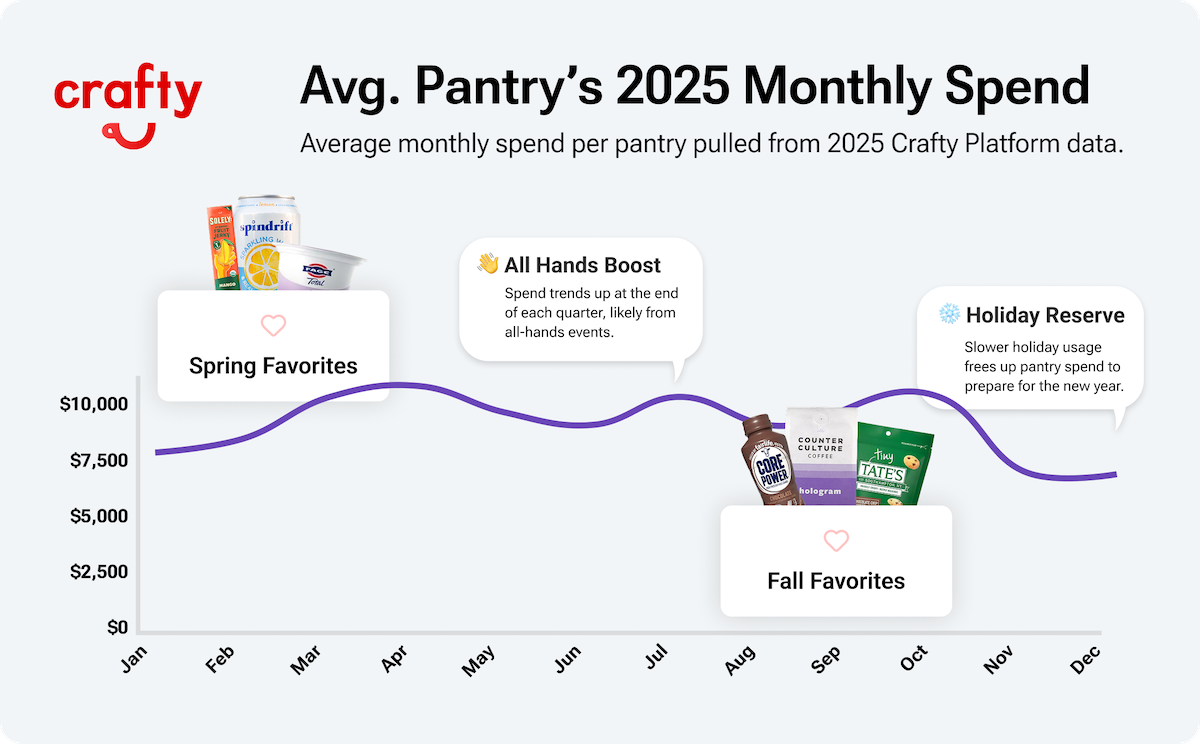
Pantry spend is not static. Although the average office pantry comes in around $9,562 per pantry per month, the real story is how that number shifts throughout the year.
Pantry investment moves with team rhythms, company milestones, and seasonal energy. It rises when teams gather, levels out during steady operating periods, and slows during quieter stretches. When you step back and look at the full calendar, clear patterns emerge that reveal how workplaces use food to support engagement, connection, and momentum.
Let's dig in!
The Rhythm of Pantry Spend in 2025
Across 2025, pantry investment followed a clear cycle.
- Q1 Build-Up: Spend begins steadily and climbs into spring as teams return from holiday breaks and reestablish in-office routines
- Spring Lift: March and April see elevated spend tied to stronger attendance and increased team engagement
- Quarter-End Boosts: Spend trends upward at the end of each quarter, likely due to all-hands meetings and milestone events
- Summer Stabilization: Mid-year spending levels off as vacations and summer holidays take effect
- Fall Acceleration: September and October bring renewed momentum as teams regroup post-summer
- Holiday Reserve: November and December see predictable slowdowns due to holiday closures and PTO. Many teams use this period to prep for the new year
How Workplaces Can Apply These Insights
Understanding these rhythms allows workplace leaders to plan proactively instead of reacting.
- Anticipate event-driven spikes to budget intentionally for quarter-end lifts and major gatherings instead of being surprised by them
- Right-size during slower periods to adjust replenishment cadence during months with more holidays and PTO to reduce waste and protect the budget
- Align inventory with seasonality to rotate in lighter, function-forward items in spring and summer and comfort-forward options in fall and winter
Why Historical Spend Data Is Crucial for Success
Historical spend data is not just helpful. It is operational leverage.
- It eliminates guesswork: When you know what drives engagement and when it happens, you can evolve your program intentionally. Instead of reacting to one-off moments, you optimize your pantry around proven patterns.
- It strengthens financial accountability: Clear visibility into pantry spend allows workplace leaders and office managers to report on budget performance quickly and confidently. Instead of defending a line item, you can demonstrate stewardship, efficiency, and strategic allocation.
- It improves forecasting accuracy: Understanding year-over-year patterns makes it easier to anticipate quarter-end lifts, seasonal changes, and event-driven spikes. That clarity allows teams to budget more precisely and advocate for the experience they want to deliver in the year ahead.
Conclusion
Pantry spend tells a story about presence, engagement, and how teams move throughout the year.
For workplace leaders, that visibility creates control to plan proactively, forecast confidently, and evolve your program without guesswork. When a pantry strategy aligns with real behavioral patterns, it becomes a deliberate investment in experience, culture, and performance.
Related Resource
News
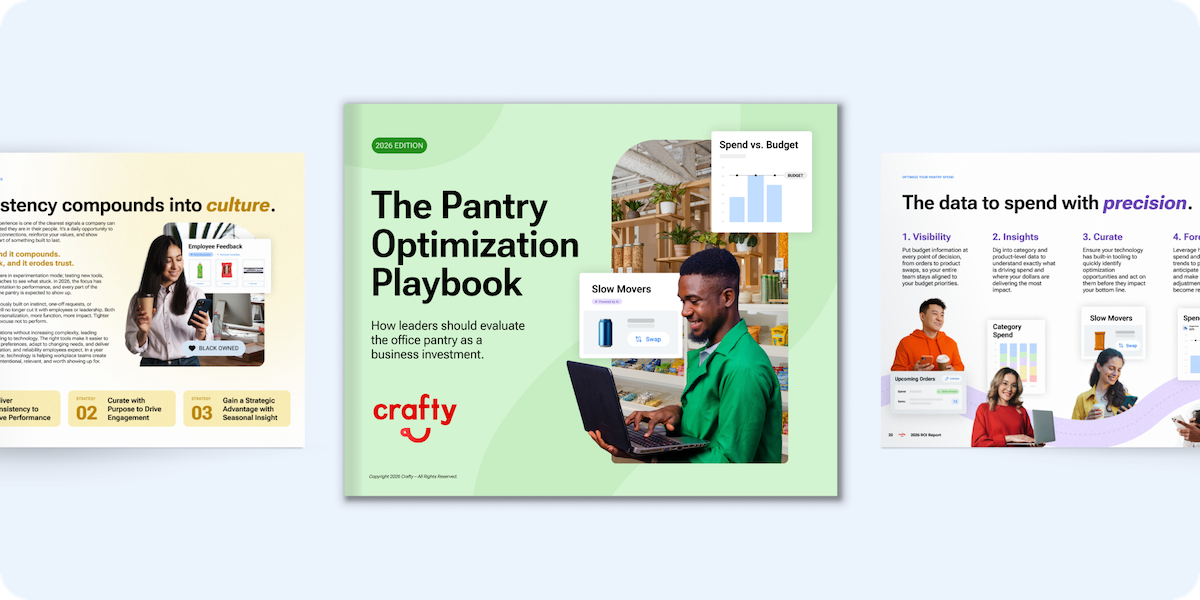
Crafty Launches 2026 Pantry Optimization Playbook as Workplace Leaders Face New Pressure to Prove ROI
July 8, 2026
Blog
Data Bites: The State of Workplace Hydration
July 7, 2026

Blog
August Holidays for Work: Breakroom Snacks to Boost Employee Engagement
July 2, 2026

Blog
7 Learnings from the Mondelez International Snack Report
July 1, 2026
News
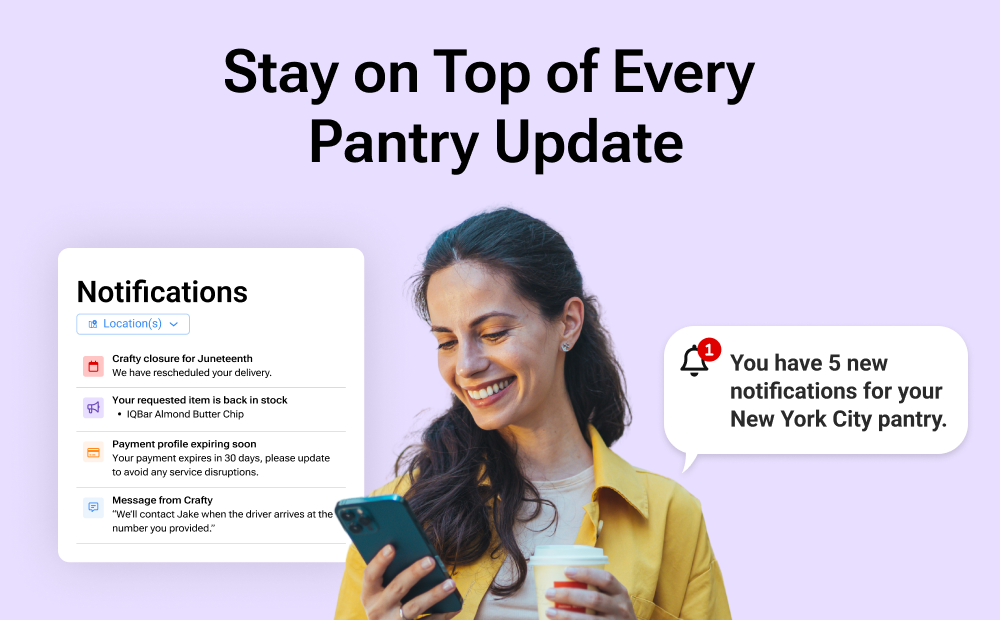
Crafty Launches Notification Center to Give Enterprise Workplace Teams Real-Time Operational Control
June 25, 2026
![The Insider's Guide to Choosing an Office Snack Service Provider [2026]](https://cdn.prod.website-files.com/68ef636bea7f569ab00567aa/6a342b8728e57bbb0e58bd25_Biotech%20Company%27s%20Snack%20Wall%20in%20San%20Francisco.jpg)
Blog
The Insider's Guide to Choosing an Office Snack Service Provider [2026]
June 18, 2026

Blog
Data Bites: The Top Employee-Voted Office Snacks
June 16, 2026

Blog
Data Bites: Fibermaxxing Inside the Workplace
June 9, 2026

Blog
Summer Office Pantry Ideas to Beat the Heat
June 1, 2026
Blog
July Holidays for Work: Snackable Celebrations to Refresh Your Breakroom
May 27, 2026